Electronic ISSN 2287-0237

VOLUME

THE USE OF T1W BB SIGNAL INTENSITY DIFFERENCE RATIO IN ASSESSING MYOCARDIAL DISEASE INVOLVING INCREASING EXTRACELLULAR VOLUME: A PRELIMINARY STUDY

SEPTEMBER 2017 - VOL.13 | ORIGINAL ARTICLE
OBJECTIVE:

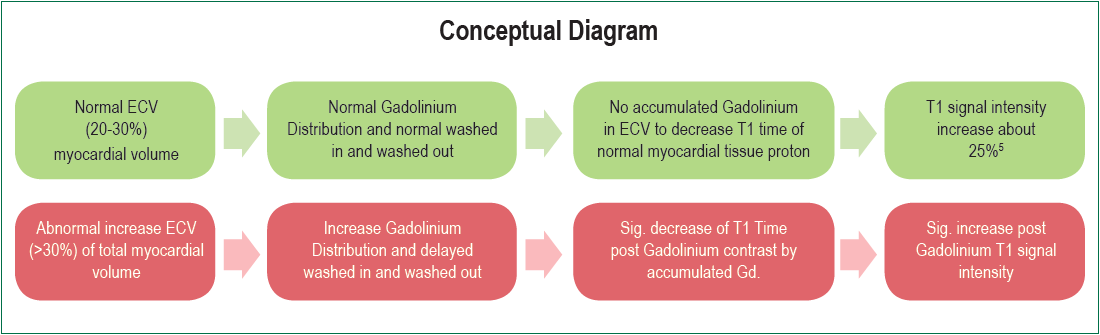
To evaluate whether the new magnetic resonance imaging (MRI) technique related to T1 weighted black blood (T1W BB) signal intensity difference ratio between pre- and post- gadolinium contrast injection can serve as a potential technique for use in differentiating normal and diseased myocardium involving the increasing myocardial extracellular volume (ECV) in terms of sensitivity, specificity and accuracy in comparison with late gadolinium contrast enhancement (LGE) MRI technique. 

MATERIALS AND METHODS:

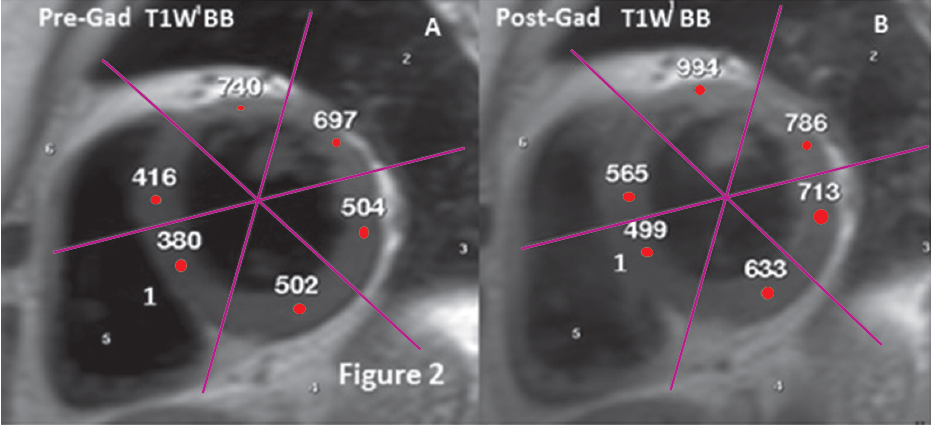
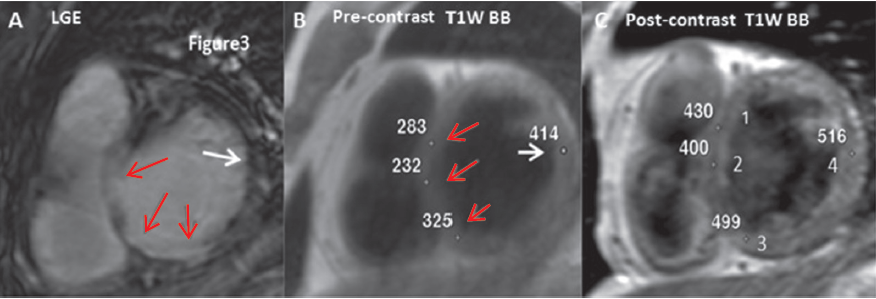
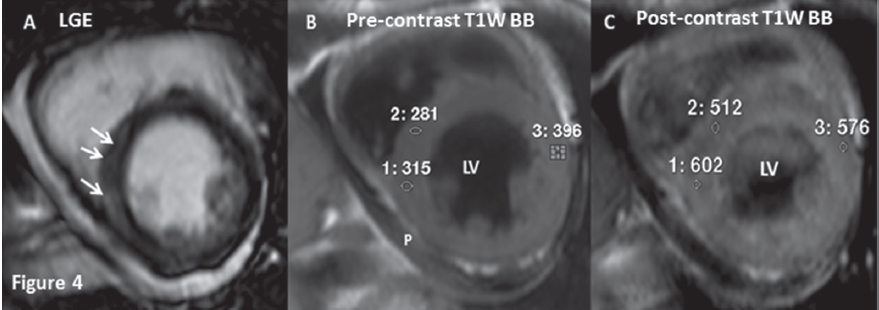
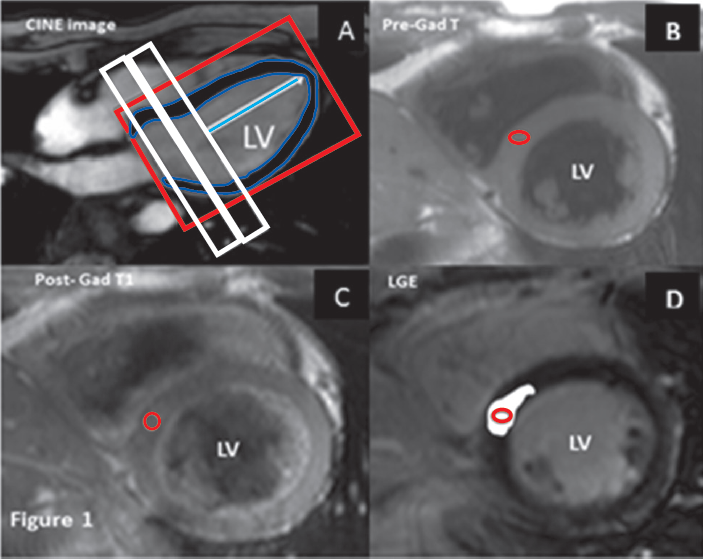
 A retrospective analysis was conducted for a pilot of a total of 14 patients with known and suspected myocardial disease who underwent a cardiovascular magnetic resonance (CMR) scan at Bangkok Heart Hospital, Bangkok, Thailand in the period from September 2016-April 2017. LGE MRI and Spin echo T1W BB MRI in both pre- and post- contrast injection were performed in all patents on short axis view in the same slice position and number of slices. The myocardial signal intensity measurement on the T1W BB in both pre- and post- contrast injection images were acquired on short axis view at the same region of interest (contrast enhancement region and negative enhancement) on LGE MRI images. T1 signal intensity difference ratio (SDR) between pre- and post- contrast were calculated in both LGE positive and negative groups. The mean T1W BB signal intensity difference ratio value > 30% was classified as abnormal increased ECV myocardium. 

RESULTS:

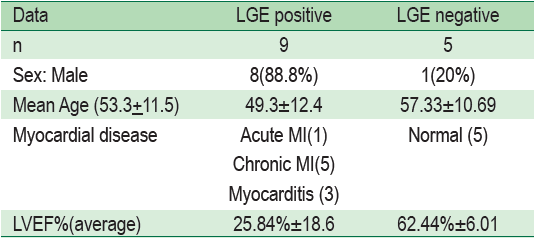
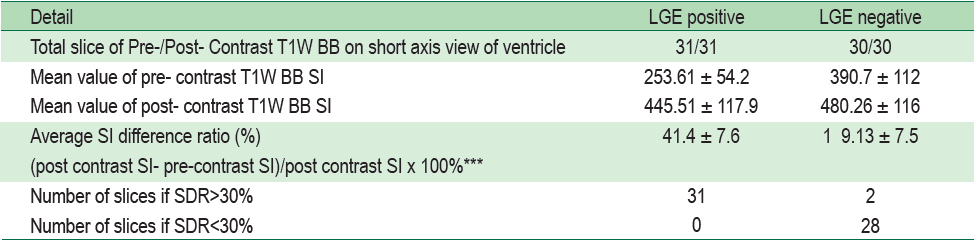
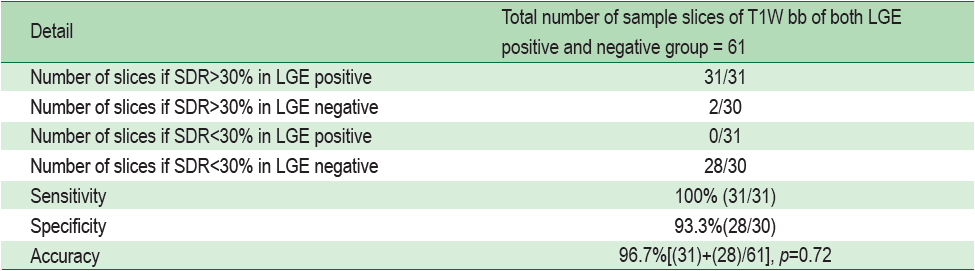
The 14 study population have a mean age of 53.3±11.5 and are 64% male. Five were normal patients with negative LGE and nine were found to have myocardial disease with positive LGE. A total of 61 sample slices on short axis view of the ventricle of each T1W BB pre- and post- contrast were obtained from all patients, 31 of 61 were from diseased myocardium with LGE positive scan and 30 were from normal myocardium with a LGE negative scan. A myocardial T1 signal difference ratio > 30% was found in 2 of 30 slices of normal myocardium with the LGE negative group and 31 of 31 slices of the LGE positive group. The mean signal difference ratio value of normal and diseased myocardium were 19.13±7.5 % and 41.4±7.6% respectively. The sensitivity and specificity and the accuracy of T1W BB difference ratio > 30% in differentiating normal from myocardium with involving increasing ECV were 100%, 93.3% and 96.7% (p=0.72) consecutively compared to the LGE MRI. 

CONCLUSION:

The use of T1W BB in assessing myocardial diseases with either a focal or diffuse involvement demonstrates a higher value ratio of extracellular space pre- and post- contrast study of more than 30% indicating myocardial disease with 100% sensitivity and 93.3% in specificity and 96.7% accuracy that is shown to be comparable to gold standard LGE technique in detecting focal increasing myocardial ECV by statistic chi-square test p =0.72 (not less than 0.05) 

Keywords:

myocardium, extracellular volume (ECV), late gadolinium enhancement (LGE), MRI, T1 weighted black blood (T1W BB), Signal intensity (SI), Signal intensity difference

DOI:

10.31524/bkkmedj.2017.09.004

MEDIA
Conceptual diagram A: B
Conceptual diagram A: Normal ECV gives normal range of increasing T1W BB signal intensity (20-30%) after contrast injection 15-20 minutes Conceptual diagram B: Abnormal ECV gives increasing T1W BB signal intensity after contrast injection of 15-20 minutes > normal range (>30%)
Table 1.
Demographic data (n=14)
Table 2
Results of T1W bb SI difference ratio analysis
Table 3:
Studied technique and statistical assessment method of the new technique
Figure 2A-B:
normal patient case: Demonstration of the T1 signal intensity ratio between pre-Gd T1W BB SI and post Gd T1W BB SI <30% in all myocardial regions that indicate no abnormal increasing ECV [e.g. region 1 , SDR= (Post- contrast T1 SI (499) -Pre- contrast T1 SI (380)/ Post- contrast T1 SI (499) x100) = 23.8%]
Figure 3A-C:
chronic myocardial infarction case shows the calculated results of difference ratio between pre-Gd T1 SI and post Gd T1 SI >30% in myocardial infarction region 1,2,3 segments on T1W BB images that indicate an abnormal increase of ECV. The results are compatible with contrast enhancement region shown on LGE MRI image that indicates fibrosis of prior myocardial infarction [e.g. region 2 , SDR= (post- contrast SI -pre-contrast SI)/post- contrast SI x 100%) = (400-232/400x100%)=42% and at the myocardial region with negative contrast enhancement, region 4 (white arrow sign on LGE MRI image), SDR= (516-414 /516x100%)=19.7% ]. A: LGE MRI image shows myocardial infarction (red arrows), Normal region (white arrow), B: Pre-contrast T1W BB image, C: Post- contrast T1W BB image, 2= region 2, 4= region 4
Figure 4 A-C:
acute myocarditis case reveals the difference ratio between pre-Gd T1 SI and post Gd T1 SI >30% in LV infero-septal wall [e.g. region 1 (positive LGE ) , (SDR=post- contrast SI - pre-contrast SI)/post- contrast SI x100%)=(602-315/602x100%)=47.6%] that indicates an abnormal increase of ECV which is compatible with contrast enhancement on LGE image (white arrow), at the negative LGE (region3) [SDR=(576-396)/576x100%)=31.5%]. The result of SI difference ratio of >30% is found in LGE positive region (region 1) and LGE negative region (region 3) indicates a diffuse abnormal increasing ECV that is compatible with diffuse expansion myocardial edema of acute myocarditis. A: LGE MRI image shows sub-epicardial myocardial contrast enhancement (white arrow) that is suggestive of myocarditis. B: Pre-contrast T1W BB image. C: Post- contrast T1W BB image , 1= region 1, 3= region 3, P= pericardial effusion
Figure 5A-C:
acute myocardial infarction with post PCI and stenting case. The signal intensity difference ratio between pre-Gd T1 SI and post Gd T1 SI >30% at the infarct myocardium (region 1) [e.g. region1, SDR= (708- 471)/708x100%=33.4%] is compatible with contrast enhancement area on LGE MRI and also the adjacent area (region2,3) with LGE negative (region 2), SDR=(803- 450)/803x100%=43.9%, (region 3 ), SDR=(455- 258)/455x100%=43.3% these indicate myocardial infarction with diffuse edema. A: LGE MRI image shows myocardial infarction (white band,*, region 1). B: Pre-contrast T1W BB image. C: Post- contrast T1W BB image.
Figure 1A-D:
“guide to go” demonstration of MRI imaging steps for T1W BB SI difference ratio analysis Step1 (A): Perform gradient echo CINE MRI pulse sequence on 4- chamber view as a reference image for short axis view. Step2 (B): Perform T1W BB spin echo pulse sequence pre-contrast on short axis view with whole heart coverage or covers region of interest. Step3 (C): Perform T1W BB spin echo pulse sequence after gadolinium injection for 15-20 minutes contrast on short axis view with whole heart coverage or covers region of interest in the same protocol (locator location, number of slices, gap between slice and all MRI parameters) as pre-contrast T1. Step4 (D): Perform 3D LGE MRI (multiple slices with single breath hold) after gadolinium injection for 15-20 minutes contrast on short axis view with whole heart coverage or covers region of interest in the same protocol (locator location, number of slices, gap between slice and all MRI parameters) as T1W BB pulse sequence. Bright white region on Figure 1D represents the late contrast enhancement region
SEARCH VOLUME & NUMBER
GO
RECENT VOLUME & NUMBER