Electronic ISSN 2287-0237

VOLUME

IMPAIRED REGIONAL MYOCARDIAL FUNCTION DETECTION USING THE STANDARD INTER-SEGMENTAL INTEGRATION SINE WAVE CURVE ON MAGNETIC RESONANCE IMAGING

FEBRUARY 2012 - VOL.3 | ORIGINAL ARTICLE
OBJECTIVE.

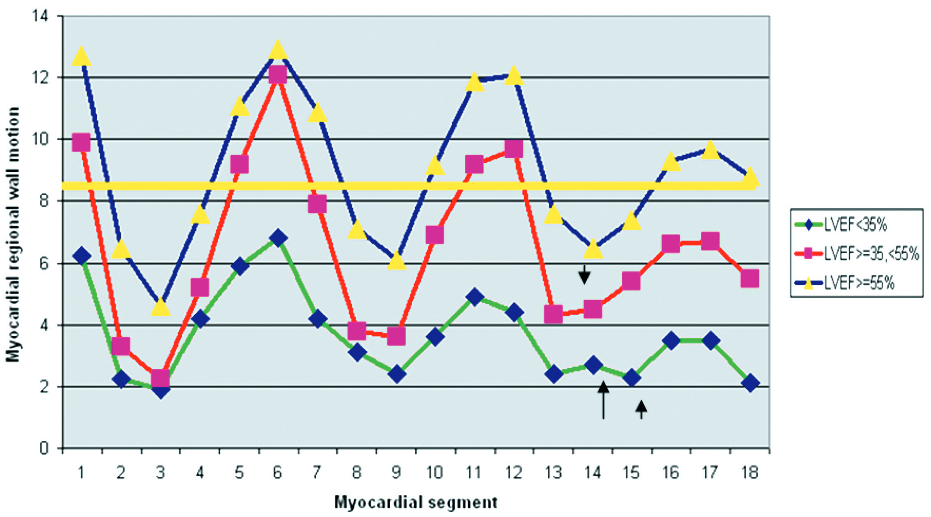
1. To quantify the value of myocardial regional wall motion and to study the inter-segmental integration pattern of the circumferential regional wall motion of the left ventricle using Magnetic Resonance Imaging (MRI) in patients with normal global and regional left ventricular systolic function (LVEF ≥ 55%) and compare results to groups with impaired left ventricular systolic function (LVEF ≤ 55%).

2. To prove that the inter-segmental integration pattern of normal myocardial regional wall motion is consistent and can be used effectively as a complimentary tool with visual estimation method to detect the impaired myocardial regional wall motion.

MATERIALS AND METHODS.

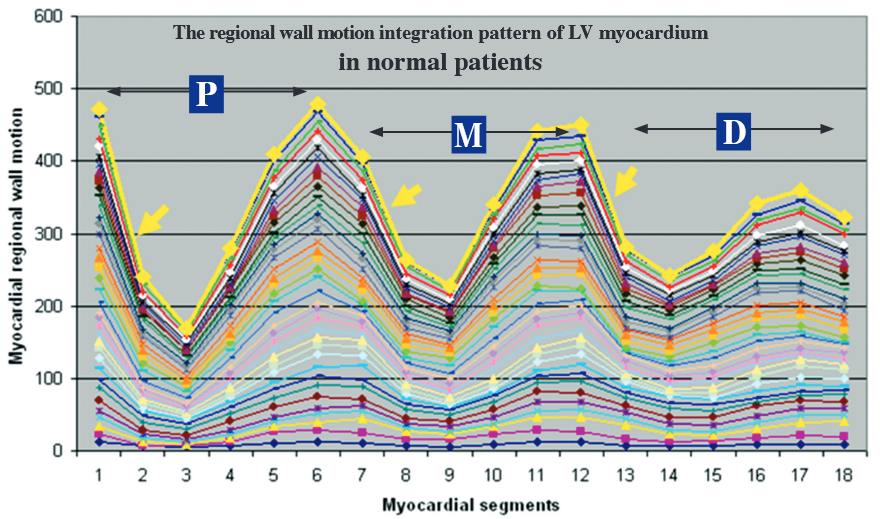
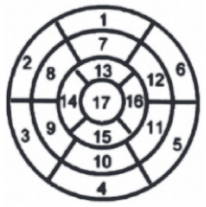
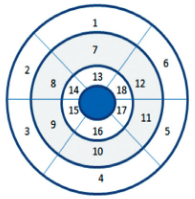
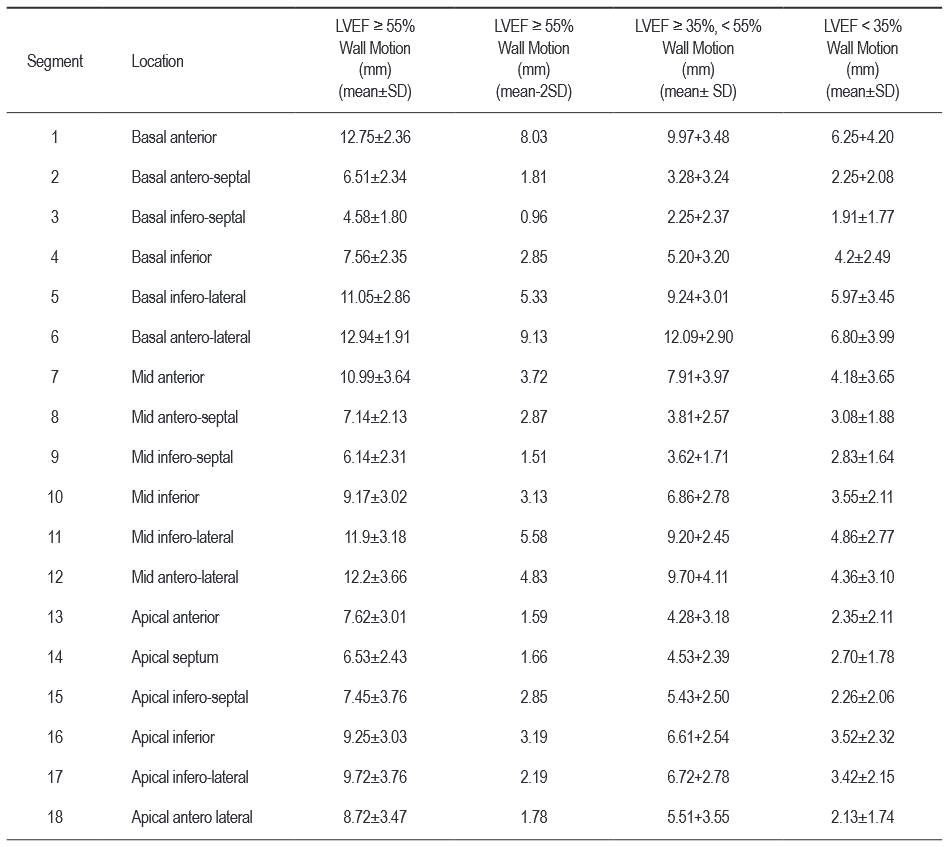
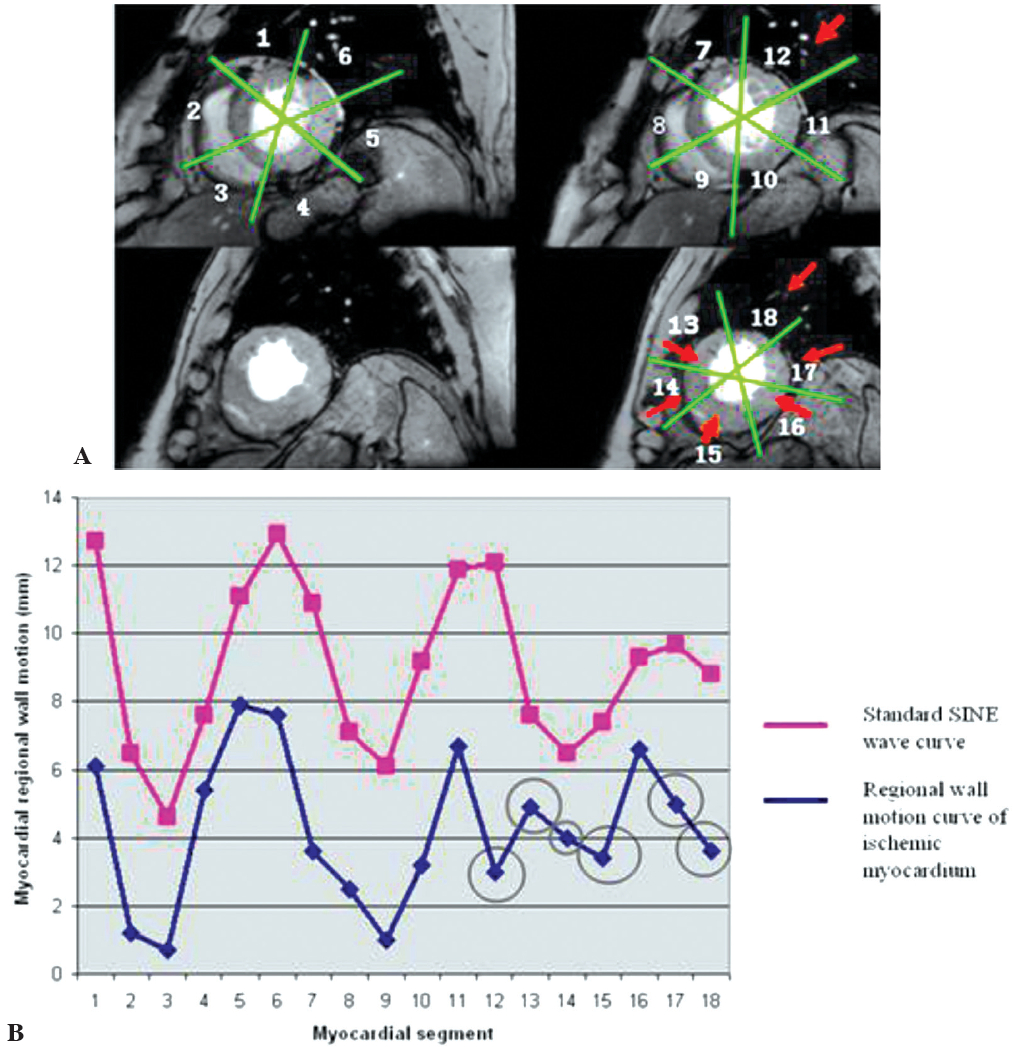
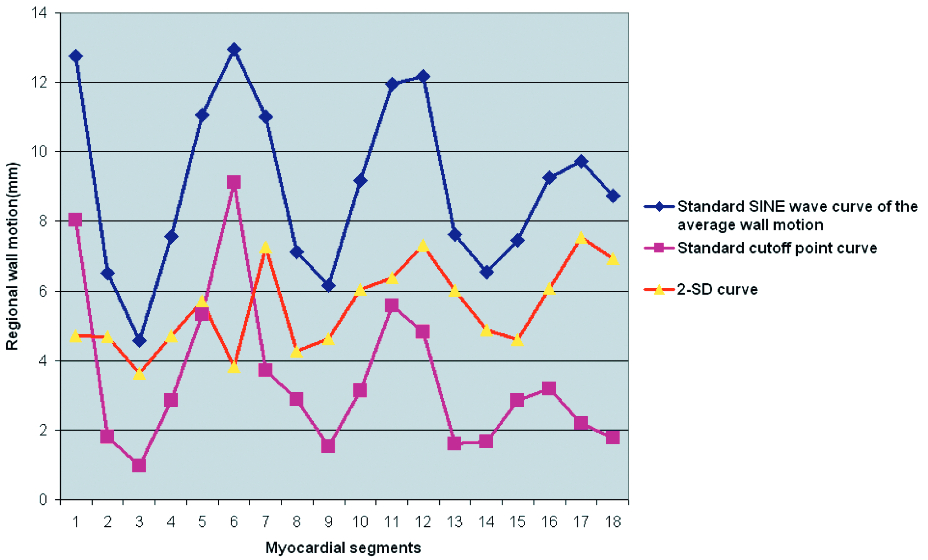
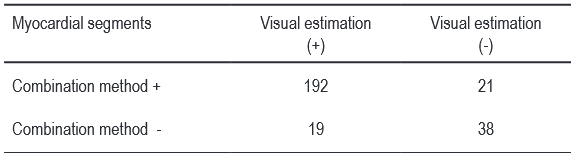
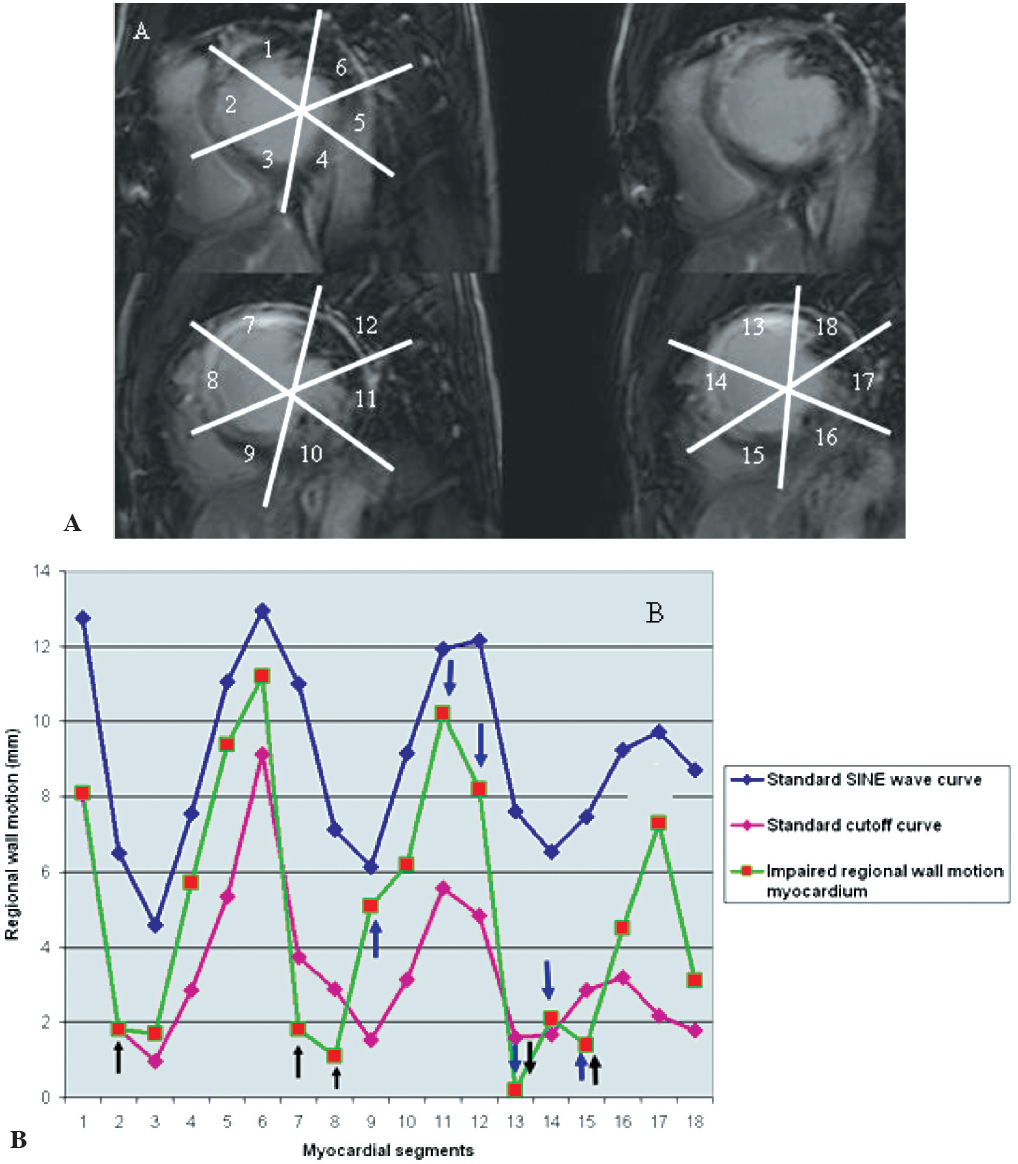
A total of 60 adult patients (above the age of 15 years old) who underwent cardiac MRI during January to October, 2011 were recruited. Thirty-six patients had normal ejection fraction (LVEF ≥ 55%, Mean = 64%) and normal myocardial regional wall motion, 12 patients had moderate systolic dysfunction (LVEF ≥ 35%, < 55%, Mean = 49.3%) and 12 patients had severe systolic dysfunction (LVEF < 35%, Mean = 22.8%). We retrospectively analyzed and measured the left ventricular ejection fraction and regional wall motion by computerized program in the Brilliance work station of 3 Tesla (3T) MRI. The myocardial wall was divided into 3 parts, the basal (the myocardial level above papillary muscle), the mid (the myocardial level at the papillary muscle) and the apical part (the myocardial level below the papillary muscle). Myocardial wall in each part was segmented into 6 segments for regional wall motion assessment, which was modified from the American Heart Association (AHA) recommendation. The regional wall motion in each ejection fraction group was measured in millimeters and averaged. The average value of each myocardial segment of each systolic function group was plotted in line curve from segments 1-18 (basal to apical part) to form the qualitative standard curve (Standard inter-segmental integration curve or Standard SINE wave curve) of normal regional wall motion. The myocardial segment specific standard deviation (SD) value of the normal cardiac function group was also calculated. We created the standard cutoff point curve by plotting the resulting value of the average regional wall motion value of each myocardial segment (1-18) minus the segment specific 2-SD of the average value of regional wall motion of the normal cardiac function in line curve. The standard cutoff point curve was a double functional tool because it both displayed SINE wave curve character and provided quantitative cutoff point value. We used the standard cutoff point curve in combination with the standard SINE wave curve to detect impaired myocardial regional wall motion. The impaired regional wall motion myocardial segment was considered as a distortion or deviation point from SINE wave and/or the point of curve that stood below the cutoff point value. The accuracy of these tools indetecting impaired myocardial regional wall motion were compared to visual estimation in terms of sensitivity, specificity, positive predictive value and negative predictive value.

RESULTS.

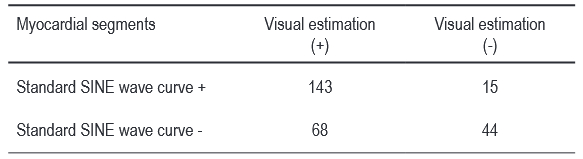
By comparison to the visual estimation method, the sensitivity, specificity, the positive predictive value and the negative predictive value of the standard SINE wave curve in impaired myocardial regional wall motion detection were of 67.8%, 74.6%, 90.5% and 32.2% respectively. By combining the standard SINE wave curve with the standard cutoff point (mean value - < 2-SD) curve to detect impaired myocardial regional wall motion, the sensitivity, the positive predictive value and the negative predictive value were increased to 90.9%, 90.4% and 66.7% respectively, compared to the visual estimation method.

CONCLUSION.

The circumferential regional wall motion integration pattern of the left ventricle in normal LVEF with normal regional wall motion patients is consistent; if characterized as a SINE wave curve, it can be used in combination with the standard cutoff point curve which displays the SINE wave character with a quantitative cutoff point, thus providing us with an additional support tool, to the visual estimation method, to detect impaired myocardial regional wall motion with acceptable high accuracy.

Keywords:

MRI, Gradient echo CINE MRI, Standard SINE wave curve, Standard cutoff point curve (mean- 2SD)

DOI

10.31524/bkkmedj.2012.02.004

MEDIA
Figure 1:
Demonstration of the inter-segmental integration pattern of the normal regional wall motion of the left ventricular myocardium characterized a consistent SINE wave pattern with substantial base to apex decline of the amplitude. The left ventricular myocardium was segmented into 18 segments (modified from the American Heart Association (AHA) criteria). Myocardial segments 1-6 were of basal or proximal part (P), segments 7-12 were of mid part (M), segments 13-18 were of apical or distal part (D).
AHA recommendation for myocardial segmentation
Studied design : Modified AHA recommendation map of myocardial segmentation
Table 1:
Value of left ventricular myocardial wall motion in normal systolic function (LVEF > 55%), moderately imapired systolic function ( LVEF > 35% , < 55%) and severely impaired systolic function (LVEF < 35%)
Figure 2:
Demonstration of the comparison of the inter-segmental integration pattern of the left ventricle between normal group (LVEF> 55%) and the impaired myocardial function group (Moderately impaired : LVEF >35, <55% , Severely impaired : LVEF<35% ). Black arrow pointed the distortion points from SINE wave which indicated impaired myocardial regional wall motion segments.
Figure 3A-B:
Demonstration of the application of the standard SINE curve as a tool for impaired regional wall motion detection by parallel comparing to the curve of regional wall motion of the interest case. The distortion point segment point from SINE wave curve was considered an impaired myocardial regional wall motion segment as shown in circle.
Table 2:
Correlative documentation of impaired myocardial segments between the visual estimation method and standard SINE wave form curve. The total studied myocardial segments were of 270 segments of 15 adult patients. The sensitivity, the specificity, the PPV and the NPV were of 60.8% (143/211), 74.6% (44/59), 90.5% (143/168) and 32.2% (44/112) respectively.
Figure 4:
Demonstration of strandard SINE wave curve, myocardial segment specific 2-SD curve and standard cutoff point curves (mean-2SD) of normal regional wall motion. Standard SINE wave curve was a qualitative tool, which was used to depict impaired myocardial regional wall motion segment by depicting the point of distortion from SINE wave. The standard cutoff point curve (segment specific mean-2SD curve) provided the segment-specific quantitative cutoff point value. Myocardial segment that has regional wall motion < segment specific mean-2SD of the average referent point is counted as for impaired regional systolic function myocardium. The standard cutoff point curve was a double function tool, which provides both qualitative and quantitative properties.
Table 3:
Correlative documentation of impaired myocardial segments between the visual estimation method and combination method (using standard SINE wave curve plus standard cutoff point curve. The sensitivity, the specificity, the PPV and the NPV were of 90.9% (192/211), 64.4% (38/59), 90.1% (192/213) and 66.7% (38/59) respectively.
Figure 5A-B:
Demonstration of the application of the standard SINE curve tool plus the standard cutoff point curve to detect the impaired myocardial segment in validated prior myocardial infarction case. A: Delayed contrast enhancement study images showed myocardial contrast enhancement (bright signal) of myocardial infarction area corresponding to the impaired myocardial regional wall motion. B: Demonstration of using standard SINE wave curve combined with the standard cutoff point curve as tool to define impaired myocardial regional wall motion segment. Blue arrow indicated impaired myocardial regional wall motion depicted using standard SINE curve alone. The impaired myocardial regional wall motion segment was shown as a distortion point from the SINE wave. Black arrow indicates the impaired myocardial regional wall motion depicted by the standard cutoff point alone and the impaired myocardial regional wall motion segment was the point that stood below the standard cutoff point curve. The total impaired regional wall otion myocardial segments were all myocardial segments which distorted from SINE wave curve and/or the segments that stood below the stand cutoff point curve.
SEARCH VOLUME & NUMBER
GO
RECENT VOLUME & NUMBER