Electronic ISSN 2287-0237
In today’s globalized world, the hospital’s clients can access more health information and have more interest in their health care and in their rights as a result of better education. Also,there are wider choices of health care services nowadays resulting in higher expectations. Therefore, clients tend to seek health care services that meet their expectations.1-3 So service satisfaction becomes an indicator of quality and efficiency of the healthcare system. Thus,both government and private institutions need to continually improve their services to meet the satisfaction of hospital clients.
Genuine quality healthcare services consist of professional principles and service quality as well as perception of quality.4 If clients’ perceptions are equal to or higher than their expectations, the service is considered high quality. On the other hand, if the clients’ perception is worse than their expectations, it is low quality.5 These facts do not show only the service quality of hospitals, but they also reflect the service problems and solutions employed to meet the expectation of hospital clients. Therefore, hospital service quality development to meet clients’ expectation is extremely important.6 Service improvement, health assurance standard upgrade, and the reputation and image of a hospital all contribute to expanding numbers and groups of clients resulting in higher revenues. Also,a good management which avoids lawsuits and complaints from clients shows better quality of service in every aspect including of the clinic itself and general services.7 Previously, a study of expectation and perception of clients of an out-patient department shows service perception is lower than service expectation. The factors involving the expec- tation and perception are sex, education, marital status, occupation, income, healthcare right and frequency of use.8-14
The researcher, as a professional nurse at The Risk Assessment Clinic, Chulabhorn Hospital, is interested in studying the service expectation and service perception of The Risk Assessment Clinic’s clients. The purpose of the research is as follows:
This study is a survey research. Samples are of 400 clients of The Risk Assessment Clinic, Chulabhorn Hospital. The research uses Yamene’s formula for the exact sample size is unknown.16 The statistical significance level is 0.05 using simple random sampling method.
1.Demography: sex, age, educational background, marital status, occupation, income, healthcare right, frequency of service use and service type.
2.35-questionnaire about service expectation and service perception edited from Somusa Sakhriruk13 divided into 4 aspects; service provider, service quality, service information and service venue. The Likert Scale is used as a scaling method divided into 5 levels:
3.Other comments: Research materials were approved for accuracy, acuity and content coverage and were trialed on 30 samples. By analyzing Cronbach’s Co-effiiency, the data validity showed a level of 0.85.
Data collection
After being approved by The Research Ethics Com- mittees and Chulabhorn Hospital Director, the researcher started collecting data from questionnaires completed by clients of The Risk Assessment Clinic after they have received services provided by the clinic. The researcher introduced herself to the respondents, to explain the purpose of the research and to inform them of their rights to answer the questionnaires and their rights to withdraw from the research at any time with no detrimental impact on the quality of their healthcare service. All data remain confidential and will be presented as an overall picture only. The sample groups were given the researcher’s contact details during the duration of the survey and research (from August 1, 2011 to March 31, 2012).
Statistical analysis
This statistical analysis uses a statistical package for collecting the percentage, mean, standard deviation, and differences between the means of 2 sample groups by Independent t-test and Paired t-test and compares the differences between the means of 2 or more sample groups by F-test, followed by One-way ANOVA analysis. Where statistically significant differences occur, Scheffe’s multiple comparison is applied.
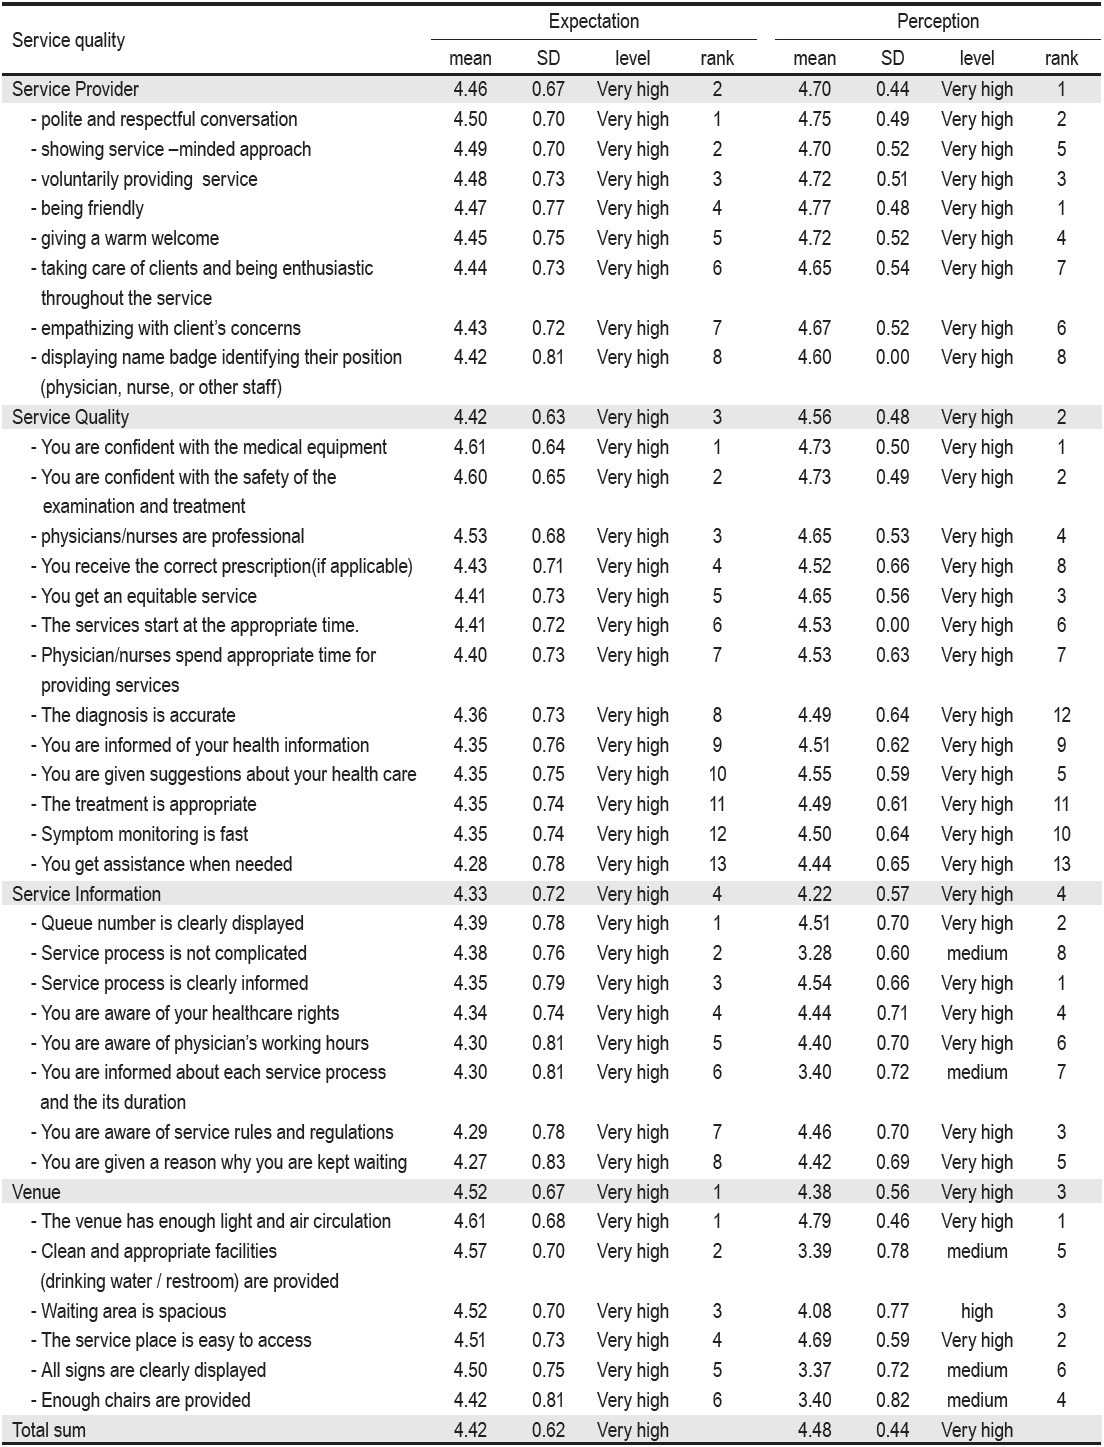
Table 1: Mean and standard deviation of sample groups classified according to service expectation’ and ‘service perception’ towards The Risk Assessment Clinic, Chulabhorn Hospital (n = 400).
The comparison between service expectation and perception towards The Risk Assessment Clinic both overall and for each aspect are statistically significantly different showing that the perception mean is higher than the expectation mean (Table 2).
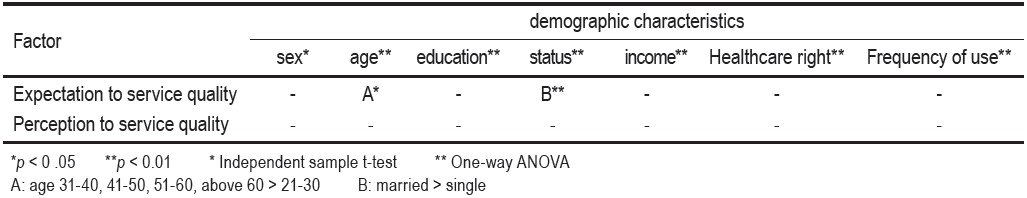
People with different demographic characteristics (sex, age, marital status, income, healthcare right, frequency of use) have different service expectations especially in the category of age and marital status. Respondents aged ≥ 31 years have significantly higher expectations than respondents aged between 21-30 years old at p < 0.05. Married respondents have significantly higher expectations than unmarried respondents at p < 0.01. However,different demographic characteristics do not significantly affect service perception. (Table 3)
The result-giving process or any additional examination needed (such as ultrasound or mammogram) should be delivered as part of a one-day process (15%), the examination queue should be shortened and the process simplified (12.75%), physicians should start the clinic earlier in the day and should be punctual (11%), the number of registration staff should be increased and computers should be used in the cancer risk assessment process (11%).
Table 2: Comparison between expectation and perception towards ‘service quality’ at The Risk Assessment Clinic,Chulabhorn Hospital (n=400).
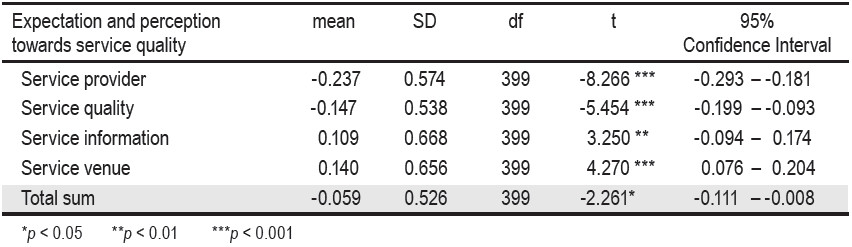
Table 3: Comparison between service expectation and perception towards The Risk Assessment Clinic, Chulabhorn Hospital of clients from various demographic characteristics.
In 400 samples, there are 126 males (31.50%), and 274 females (68.50%) aged between 21-80 years old, however respondents were mostly aged between 51-60 years old (31.50%) (x = 49.33, SD = 11.12). The breakdown by category for each respondent was as follows: the percentage of married respondents was 71.25%; with a bachelor degree education was 54%, with an occupation as a civil servant working for the government was 22.75%, with a monthly salary between ฿10,000 and ฿20,000 was 24.50% (x = 33,450.86, SD = 24,502.79), with access to civil healthcare rights was 32.50%, with a frequency of a single service use (71%), and with service type as annual medical checkup was 90%.
![]()
![]() The clients’ expectation for each aspect assessed and on overall perceptions ranked as the highest level. (x = 4.42, SD = 0.62) According to the analysis, the expectation of service venue ranked 1st, followed by service provider, service quality and service information respectively. In the same way, the perception of service is also ranked at the highest level (x = 4.48, SD = 0.44) showing that the perception of the service provider is ranked at the highest level, followed by service quality, service venue’ and service information respectively.
The clients’ expectation for each aspect assessed and on overall perceptions ranked as the highest level. (x = 4.42, SD = 0.62) According to the analysis, the expectation of service venue ranked 1st, followed by service provider, service quality and service information respectively. In the same way, the perception of service is also ranked at the highest level (x = 4.48, SD = 0.44) showing that the perception of the service provider is ranked at the highest level, followed by service quality, service venue’ and service information respectively.
Table 1: Mean and standard deviation of sample groups classified according to service expectation’ and ‘service perception’ towards The Risk Assessment Clinic, Chulabhorn Hospital (n = 400).
The comparison between service expectation and perception towards The Risk Assessment Clinic both overall and for each aspect are statistically significantly different showing that the perception mean is higher than the expectation mean (Table 2).
People with different demographic characteristics (sex, age, marital status, income, healthcare right, frequency of use) have different service expectations especially in the category of age and marital status. Respondents aged ≥ 31 years have significantly higher expectations than respondents aged between 21-30 years old at p < 0.05. Married respondents have significantly higher expectations than unmarried respondents at p < 0.01. However,different demographic characteristics do not significantly affect service perception. (Table 3)
The result-giving process or any additional examination needed (such as ultrasound or mammogram) should be delivered as part of a one-day process (15%), the examination queue should be shortened and the process simplified (12.75%), physicians should start the clinic earlier in the day and should be punctual (11%), the number of registration staff should be increased and computers should be used in the cancer risk assessment process (11%).
Table 2: Comparison between expectation and perception towards ‘service quality’ at The Risk Assessment Clinic,Chulabhorn Hospital (n=400).
Table 3: Comparison between service expectation and perception towards The Risk Assessment Clinic, Chulabhorn Hospital of clients from various demographic characteristics.
Both the expectation and perception of the quality of service at The Risk Assessment Clinic,Chulabhorn Hospital is at a very high level. It is in line with similar ratings found by the 13 studies conducted by Bang-orn Konklang, et al.11 showing that clients’ expectation toward overall service quality is very high.
When we compare service expectation and perception towards The Risk Assessment Clinic, Chulabhorn Hospital, the mean rating for perception is significantly higher than expectation. It reflects that The Risk Assessment Clinic has a good quality service that meets clients’ expectations especially from the service provider aspect and service quality aspect which rated higher for perception than expectation. As Zeithamal6 said, the definition of quality of a service is the comparison between expectation and perception. If service perception is in accord with service expectation meeting clients’ expectations, that service is considered to be a quality service. This demon- strates that staff at The Risk Assessment Clinic conduct themselves professionally are service oriented, and display good interaction with clients. Moreover, with our policy that focuses on easy access, fast, and safe service processes provided by a professional team and modern techniques, the clinic has created trust and confidence in our service which fulfills the clients’ expectation. However, it contrasts with some studies that show that clients have lower perceptions than expectations.9-13
The comparison between service expectation and service perception of people from different demographic categories divided by sex, age, education, marital status, income, healthcare right, and frequency of use shows that age and marital status have an influence on service expectation. People aged 30 and above have higher expectations than those who are under 30 years old. Also, married people have higher expectations than the single people do. We can draw the conclusion that people aged above 30 who are married have obtained life security and life experience so they tend to sensibly seek better healthcare services17 for their spouses, family members and themselves. However, it contrasts with other studies9,13,14,18 that people with different age and marital status do not have different expectation of service quality.
Moreover, it is found that people with different demo- graphic categories; sex, age, education, income, healthcare rights and frequency of use do not have different service perception. In the same way, Hattaya Keawkim, et al.14 study shows that these demographic characteristics do not influence service perception.
According to the statistics, the mean of service perception is higher than expectation, however when individual aspects are analysed, service information and service venue perception are still lower than expectation. Thus the relevant personnel and department should improve their service quality as follows:
Although clients’ service perception is higher than their service expectation, staff linked to the clinic should still improve their service provision. Measures that could be taken include: simplifying the service provision process, providing an estimated time of waiting, showing the signs for each process clearly, providing sufficient numbers of chairs for clients waiting for examination, including providing drinking water and clean restrooms. Moreover, the process for sharing the diagnosis and tests results should be shortened to a one-day process. Physicians should be punctual and start the service earlier in the day. The number of registration staff available should be increased. As a result, clients would receive services more quickly and waiting times would be shortened.