Electronic ISSN 2287-0237
The aims of a pilot randomized controlled trial were to investigate the effect of reverse Trendelenburg position (RTP) on back pain after cardiovascular angi- ography and interventions and to compare incidence of vascular complications at the femoral access site between experimental and control groups.
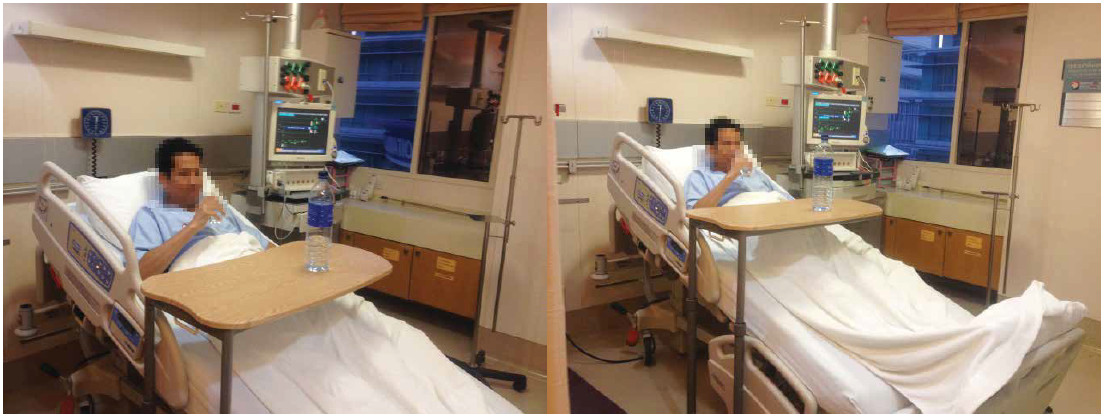
A pilot randomized controlled trial was conducted in 70 patients who underwent cardiovascular angiography and interventions via the femoral artery and received post procedural care at the intermediate cardiac care unit, Bangkok Heart Hospital from December 2015 to February 2016. The control group (35 patients) received standard care, remaining in a supine and flat position for 6-12 hours, with the affected leg straight after the intervention, whereas the experimental group (35 patients) received a 30-45 degrees RTP. Pain score, blood pressure and vascular complications were recorded.
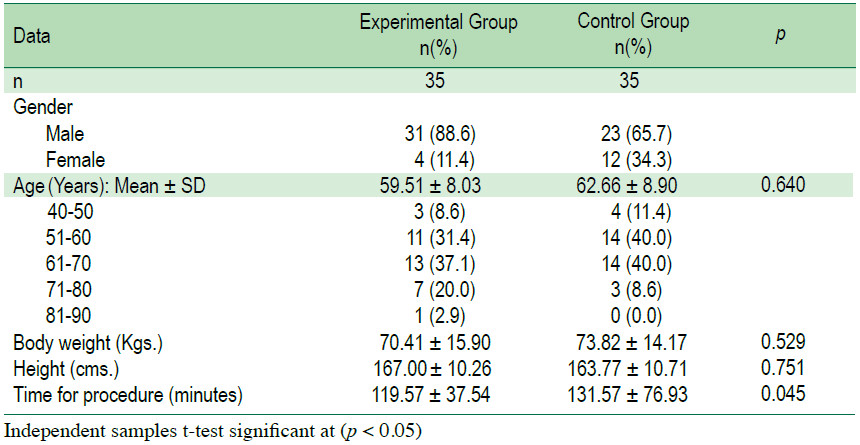
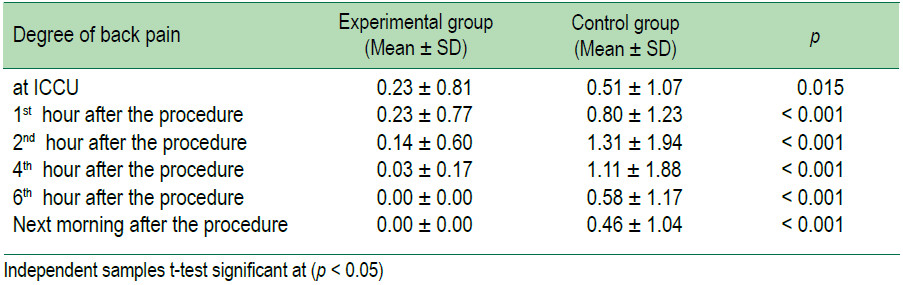
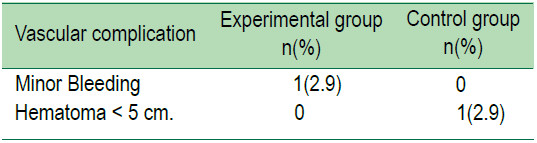
The groups were not significantly different in terms of demographic char- acteristics; age, body weight and height. Back pain scores of the control group had a significantly higher level than the experimental group (p < 0.001). The incidence of minor bleeding was 2.9 % in the experimental groups and hematoma < 5 cm. was 2.9 % in the control group. There was no active bleeding in both groups.
The findings show that RTP after cardiovascular angiography and interventions reduce or prevents back pain without increasing the chance of vascular complications.
reverse Trendelenburg position, back pain, cardiovascular angiography, cardiovascular interventions
10.31524/bkkmedj.2016.09.005