Electronic ISSN 2287-0237
Bangkok General Hospital was established at Soi Soonvijai, Bangkok, Thailand in 1972 by the Bangkok Dusit Medical Service Public Company (BDMS). Since then, BDMS has grown progressively and today the company operates 28 hospitals located in Thailand and Cambodia. Three of those hospitals, i.e., Bangkok Heart Hospital (BHT), Bangkok International Hospital (BIH), and Wattanosoth Cancer Hospital (WSH), were established in 2005 in addition to the Bangkok General Hospital at Soi Soonvijai; and today they are called collectively the Bangkok Hospital Medical Center (BMC).
A. The Initiative of Safety and Quality Culture
One of the foremost goals of BMC is to provide safe and high-quality medical care. Therefore in 2005, BMC implemented the Five-Year Quality Culture Development Program, which aimed to emphasize the importance of a culture of quality and patient safety in BMC. The concepts of quality improvement and patient safety (QPS) were the most significant components of this initiative. The objectives of the program were as follows:
The yearly program goals were initiated and achieved as follows:
Subsequently, to emphasize the concept of managing risk, BMC expanded the program to include Patient Safety and Risk Management (PSRM) program.
B. Patient Safety and Risk Management (PSRM)
The PSRM is a program that covers the management process of unexpected adverse events in four dimensions as follows:
The goal of the PSRM program is to complete each adverse event case while the patient is still in hospital care, and to encourage the patient not to seek care outside of BMC responsibility until the PSRM process is completed.
The response to adverse events is a key aspect of PSRM program. When an unexpected adverse event happens, the risk management team at BMC will categorize those events into the Five Levels of Quality Concerns and sentinel event. The severity levels in the Five Levels of Quality Concerns are comprised of Level 0 (near-miss event), Level 1 (no-harm event), Level 2 (mild adverse event), Level 3 (moderate adverse event), Level 4 (severe adverse event), and Level 5 (reputation event). The most severe adverse event is the sentinel event, which should be reported to JCI.
C. Patient Safety and Risk Management (PSRM) Program Evaluation
The purpose of PSRM program evaluation is to highlight commitment of BMC to patient safety through this program. The program during the period of 2006 – 2010 was evaluated in the following aspects.
Note:
a HEART is a self-administered questionnaire to evaluate patient perception on five categories of BMC staff perfor mance, i.e., Hearty Greeting (H), Empathy (E), Attention (A), Relation (R), and Trust (T).
b The questionnaire is developed by Hospital Customer Assess ment of Healthcare Provider and System (HCAHPS) to evaluate patient satisfaction on 10 domains.1
Results of the PSRM Program Evaluation
1. Occurrence and Customer Complaint Reports
From 2006 to 2010, the annual total number of outpatient visits and inpatient days at BMC gradually increased despite a period of slight decline of growth rate in 2009, due to the political unrest in Bangkok. The number of outpatient visits grew from 643,903 visits in 2006 to 704,646 in 2010 with a compound annual growth rate (CAGR) of 2.28%. Inpatient days grew from 110,324 days in 2006 to 114,824 in 2010 with CAGR of 1 % (Figure 1).
Meanwhile, across the five years of PSRM program implementation, the annual occurrence and customer complaint report rates of both OPD and IPD at BMC were consistent. The average percent (rate per 100 patient visits) of annual occurrence and customer complaint reports were 1.08 % (with range of 1.02 – 1.12 %) and 0.19 % (with range of 0.14 – 0.23 %) respectively (Figure 2).
The combination of occurrences and customer complaint reports is called “total adverse events”. At BMC, the percentage rate of total adverse event reports less than 1% are considered “under reporting”, the cause of which should be investigated. However the annual percentage rates of total adverse events reported at BMC from 2006 to 2010, with average of 1.27% and range of 1.25 – 1.31%, were not under reported.
The annual percentage rates of total adverse events reported by outpatient services were very low and remained relatively constant, with a slight increase of the report rates in the last two years. In the meantime, the annual report rates of total adverse events by inpatient services were 7 – 10 times greater than outpatients but also remained relatively constant. The average annual report rate of inpatients was 3.55 % (with range of 3.24 – 3.94%) (Figure 3). Therefore BMC has focused on improving inpatient interventions as opposed to outpatient interventions.
In outpatient services, the annual occurrence report rate was 3 – 7 times higher than the annual report rate of customer complaints. This ratio for inpatient services was higher than for outpatients. In the inpatient, the ratio of occurrence report rate to customer complaint report rate was 6 – 16 times. It declined to around 7 times in 2009 – 2010.
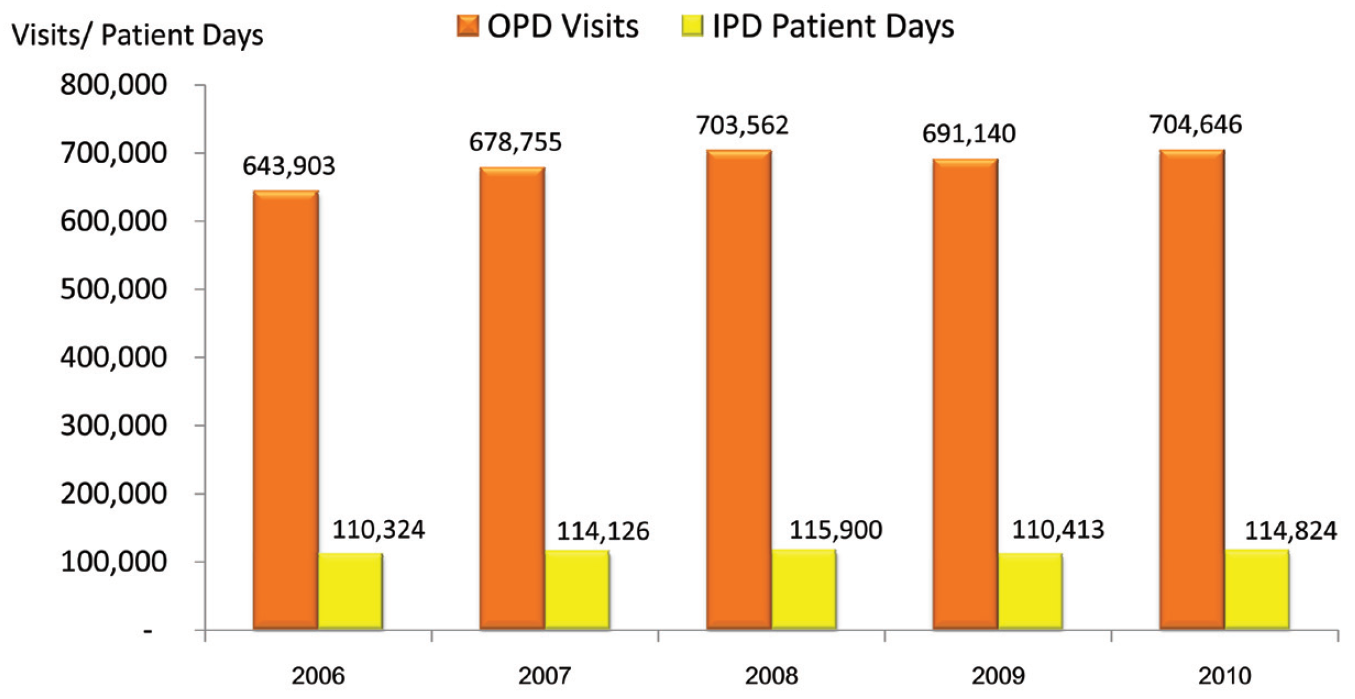 Figure 1: The total annual outpatient (OPD) visits and inpatient (IPD) days at BMC from 2006 to 2010
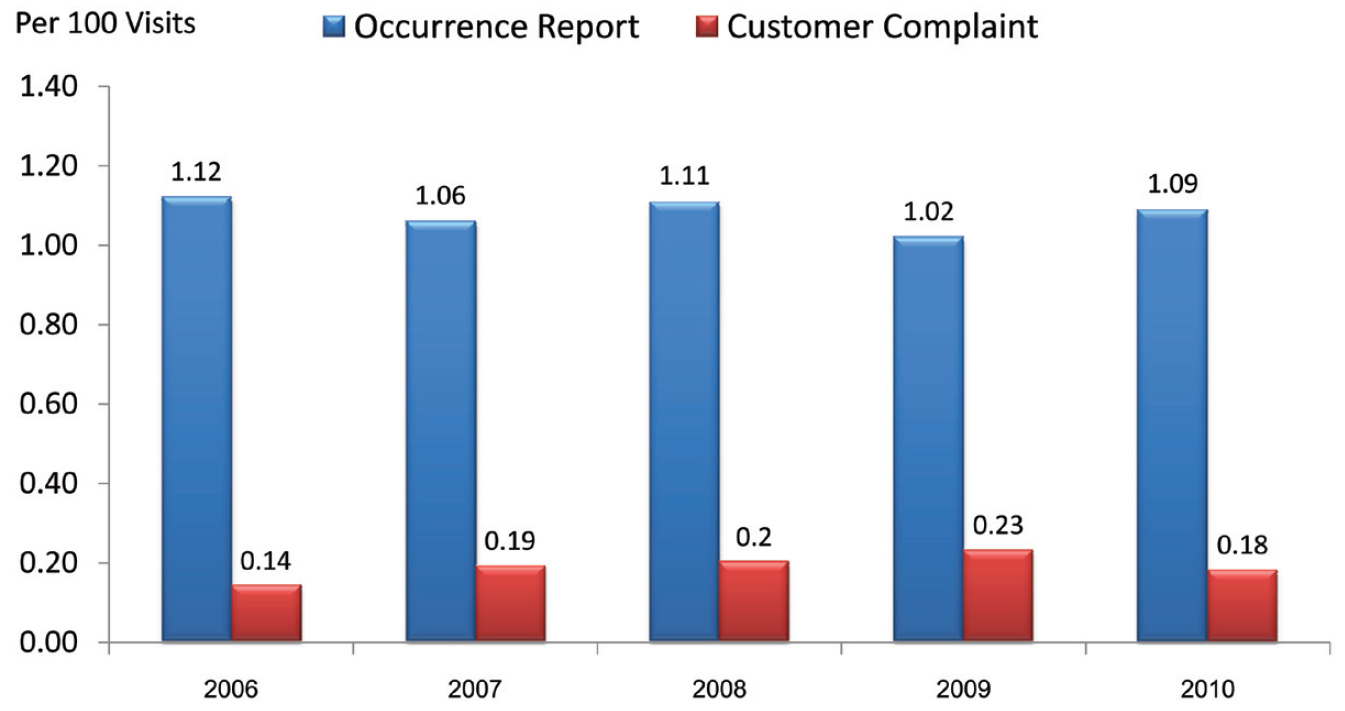
Figure 2: Rate of annual occurrence and customer complaint reports per 1,000 visits of both OPD and IPD at BMC from 2006 to 2010
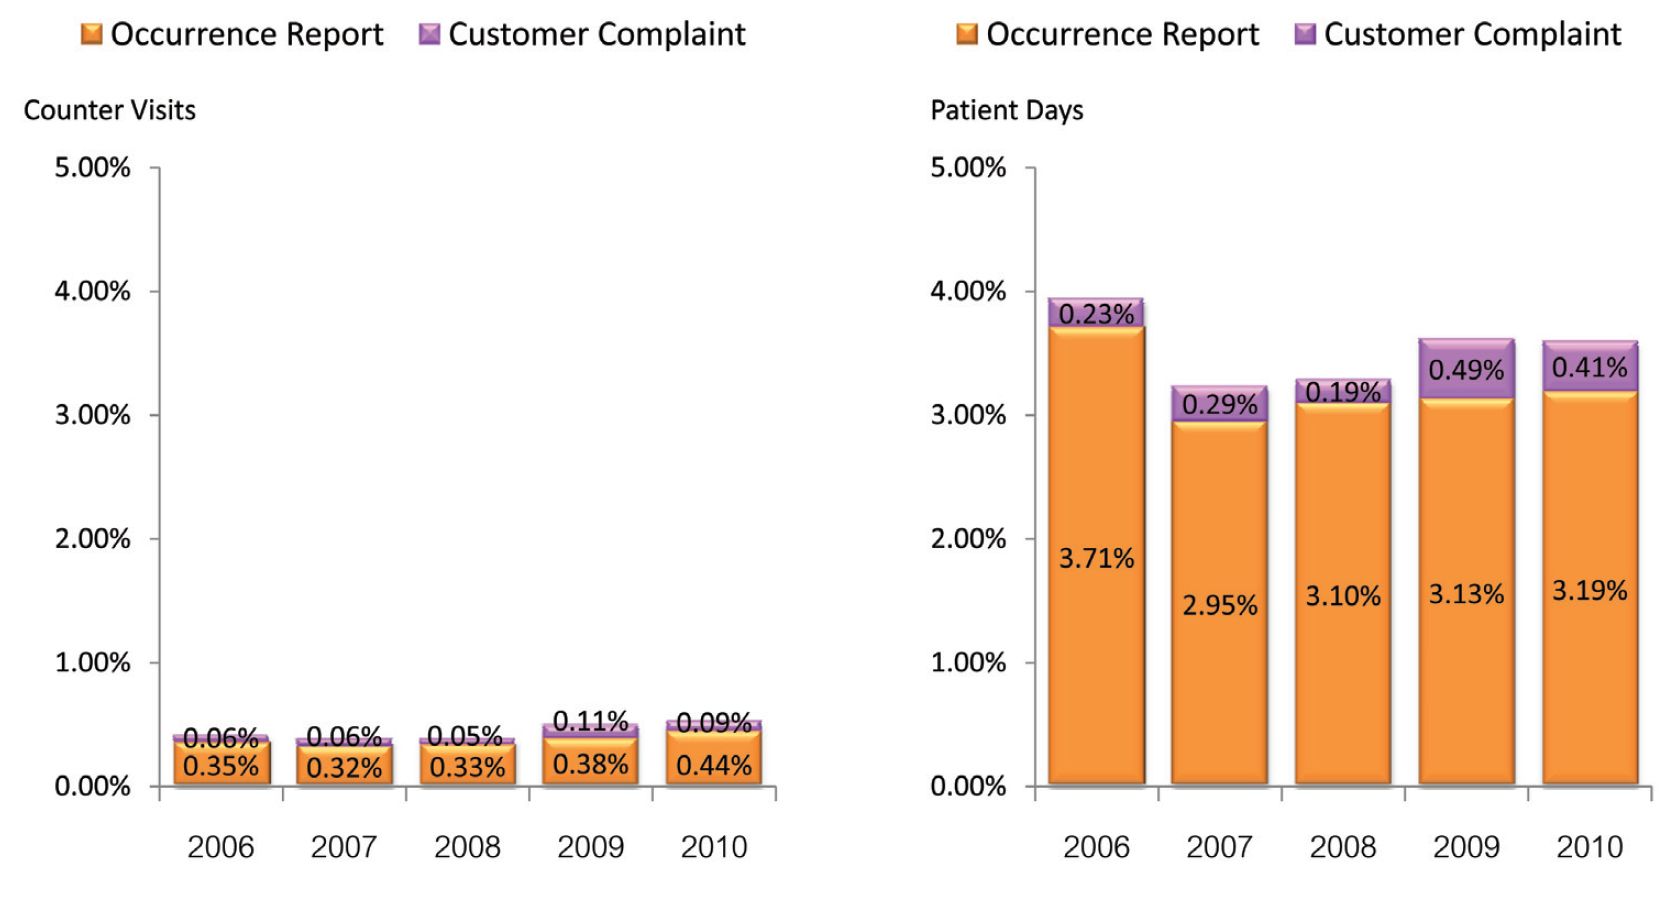
Figure 3: Percent rate of annual outpatient and inpatient experience of occurrences and customer complaints at BMC from 2006 to 2010
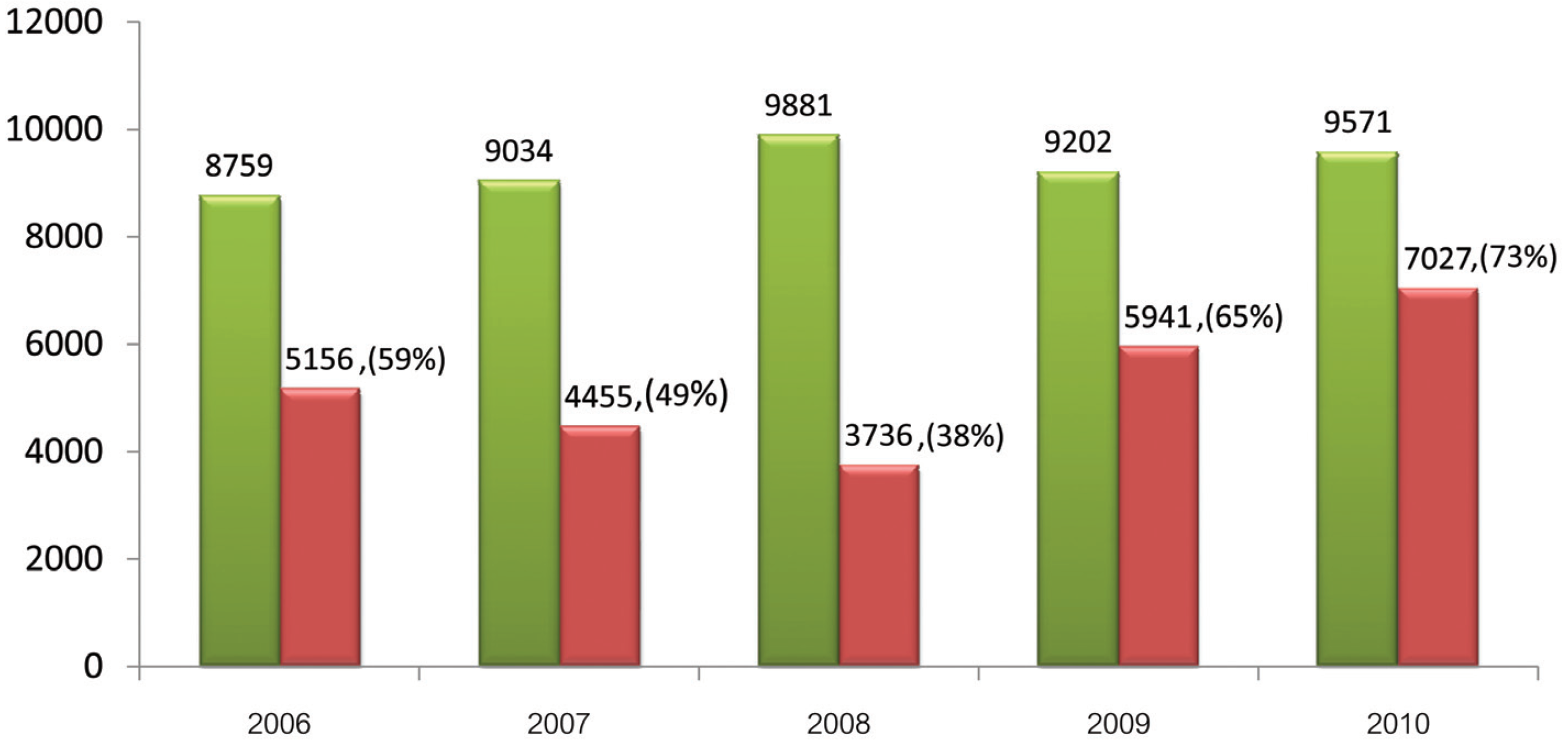
Figure 4: Annual proportion of quality concerns to annual total occurrences (combination of occurrence and customer complaint reports) at BMC from 2006 to 2010
2. Levels of Quality Concern in Occurrences and Customer Complaint Reports
There is an increasing trend in quality concerns as a proportion of annual total occurrences (total adverse events). The proportion increased from 59% in 2006, to 65% in 2009 and 73% in 2010 although it gradually declined to 38% in the first three years of PSRM program (Figure 4). The factors affecting this increasing trend are multifarious. Although not all of these factors have been fully identified, BMC hypothesizes that the main features are as follows:
In order to appropriately handle occurrences/customer complaints with quality concern, the severity of adverse concerns has been categorized into levels 0-5 and sentinel events. The levels 4-5 and sentinel events are considered as serious occurrences, which require immediate action to correct the damage and prevent its further extension. Across the five years of PSRM program implementation, the proportion of serious occurrences in both OPD and IPD services at BMC was relatively small and remained constant (Figure 5 and 6).
The most reported levels of quality concerns in customer complaints from both OPD and IPD were level 1 (no harm event) and level 0 (near miss event). The severity level 1 as reported by OPD was slightly greater in number than IPD although both had approximately the same annual proportion (80-90%) over the course of the program (Figure 5). Meanwhile reports of quality concern level 0 (near miss event) in both OPD and IPD were declining steadily (Figure 5).
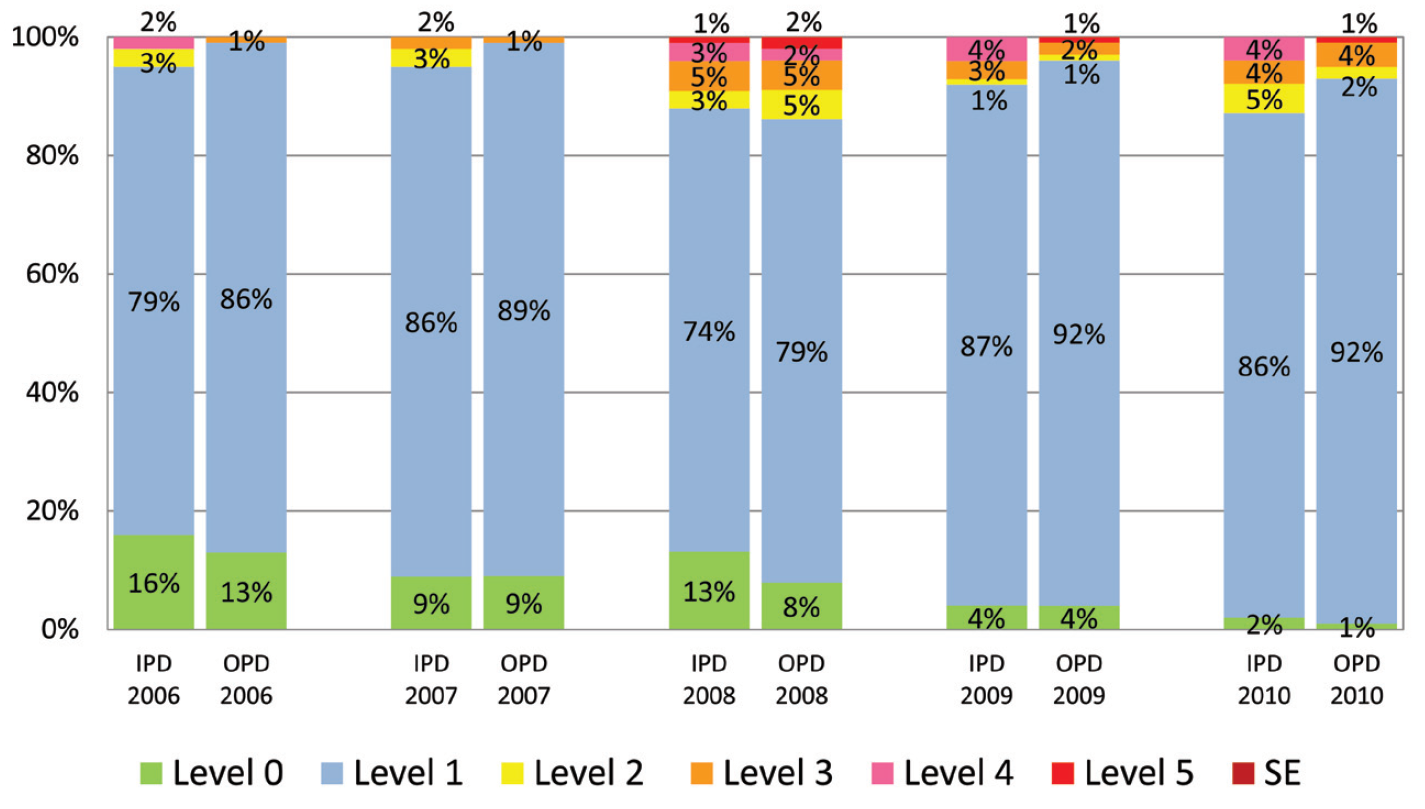
Figure 5: Proportion of severity levels of quality concerns in outpatient and inpatient complaint reports at BMC from 2006 to 2010 (SE is sentinel event)
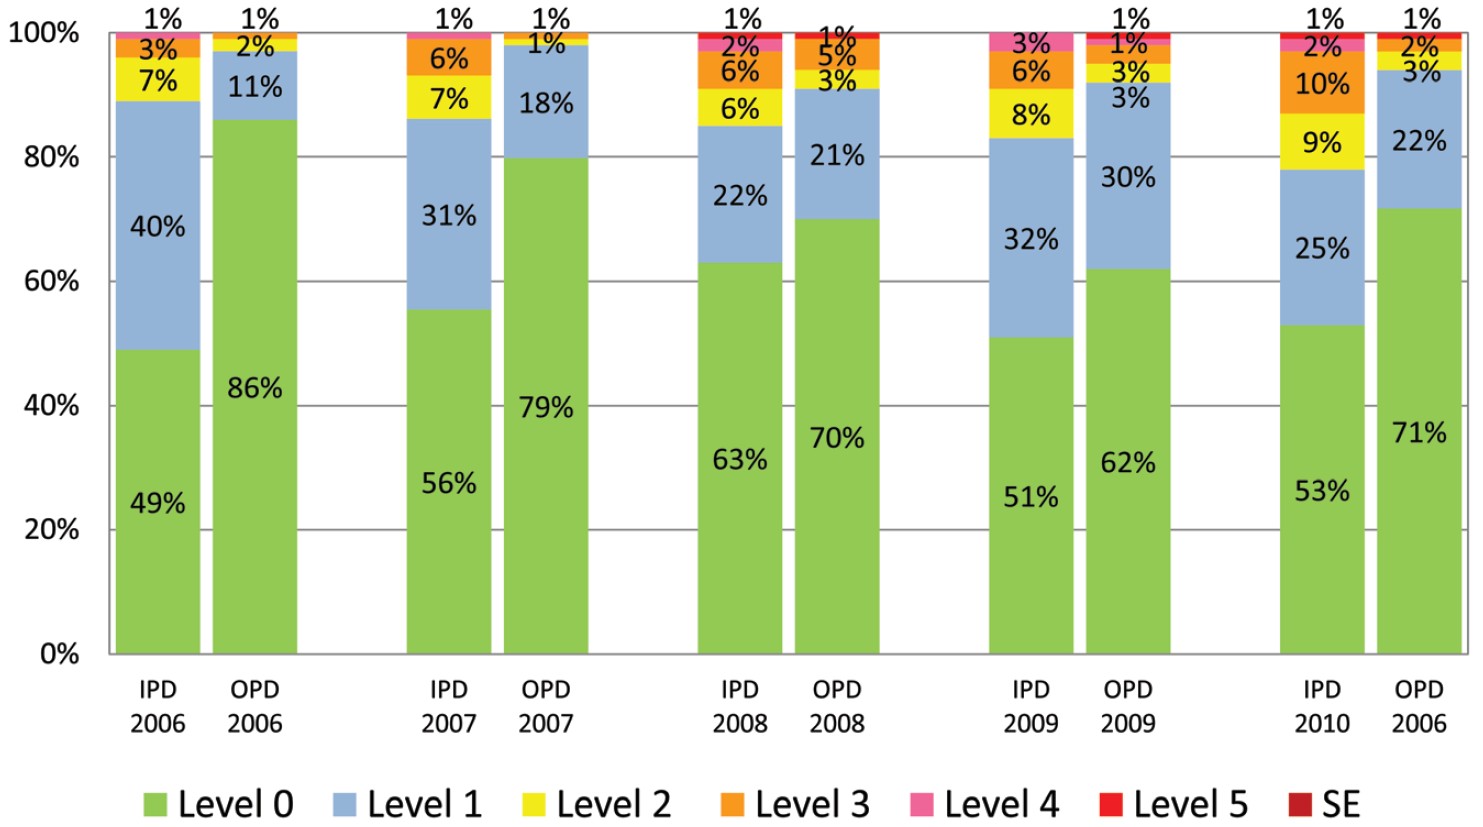
Figure 6: Proportion of severity levels of quality concerns in outpatient and inpatient occurrence reports at BMC from 2006 to 2010 (SE is sentinel event)
For occurrence reports, the main severity levels of quality concerns found were level 0 and level 1 in both OPD and IPD. The severity level 0 was more frequent among outpatients than inpatients. The annual proportion of severity level 0 in OPD and IPD were around 60-90% and 50-60% respectively across the program period. In outpatient reports, the proportion of level 0 declined over time, but in inpatients it remained within the same range. Reports for all other severity levels remained in the same range over the five-year span (Figure 6).
3. Patient Satisfaction Scores
In the BMC, the Customer Satisfaction Index (CSI) score of overall experience in both OPD and IPD improved. The annual average CSI score in OPD and IPD gradually increased from 4.16 out of 5.0 and 4.27 out of 5.0 in 2006 to 4.59 and 4.56 in 2009 respectively (Figure 7). However the scores slightly declined in 2010, which would probably be due to the change in collection method of CSI questionnaires (we outsourced in order to remain as objective as possible).
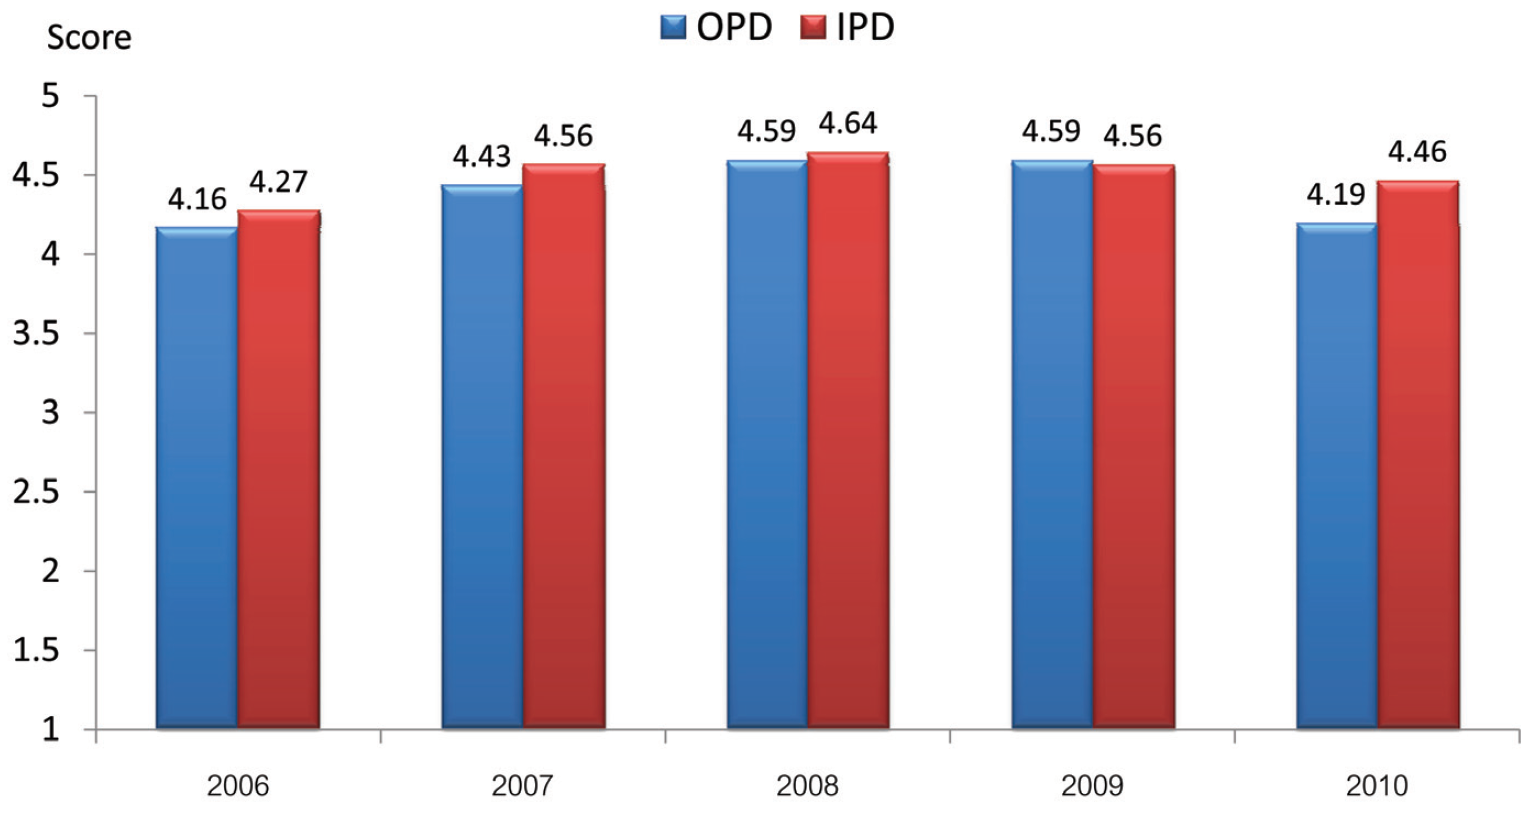
Figure 7: Annual average of Customer Satisfaction Index (CSI) scores of overall experiences in OPD and IPD at BMC from 2006 -2010
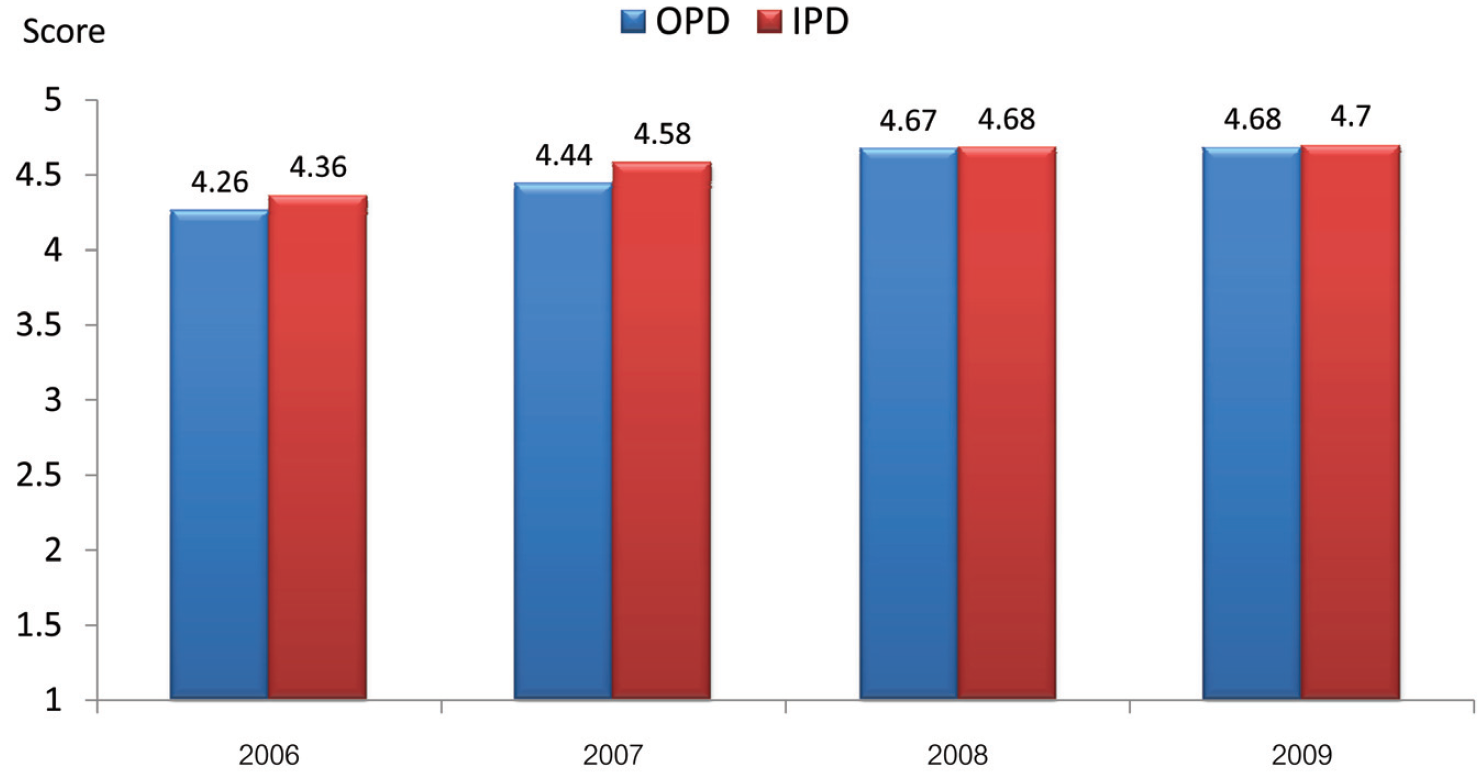
Figure 8: Annual average HEART scores for OPD and IPD services at BMC from 2006-2010.
Along with the CSI, BMC collected HEART score, which is the patients’ perception rating five categories of BMC staff performance, i.e., Hearty Greeting (H), Empathy (E), Attention (A), Relation (R), and Trust (T). In correlation with the CSI score, the annual average HEART scores at both OPD and IPD also gradually increased (Figure 8).
To compare patient satisfaction in BMC healthcare services with other international healthcare organizations, after careful research BMC concluded that the method by Hospital Customer Assessment of Healthcare Provider and System (HCAHPS)1 survey is the most acceptable method due to its successful implementation in many parts of the world, including the United States and other western countries. HCAHPS was therefore implemented at BMC, along with a dedicated personnel-training program. With the aforementioned actions, the annual average total top (top box) scores of BMC increased from 47% in 2009 to 52% in 2010 (Figure 9). The top box score is percentage of patient perception rating of highest level (8-10) for hospital performance.
4. Cost of Adverse Events/Risk Management
The total cost of reactive risk management to correct or mitigate damage to BMC’s reputation by adverse events is comprised of the cost of discounts, rework, and settlements in arbitration processes. In 2004, before the implementation of the PSRM program, the total cost of risk management was 0.76% of total revenue. In 2005, the year that the PSRM program was started, this cost was reduced significantly to 0.26% of total revenue. After that time, the annual cost increased again but subsequently settled in an annual range of 0.37% to 0.57% of total revenue (Figure 10).
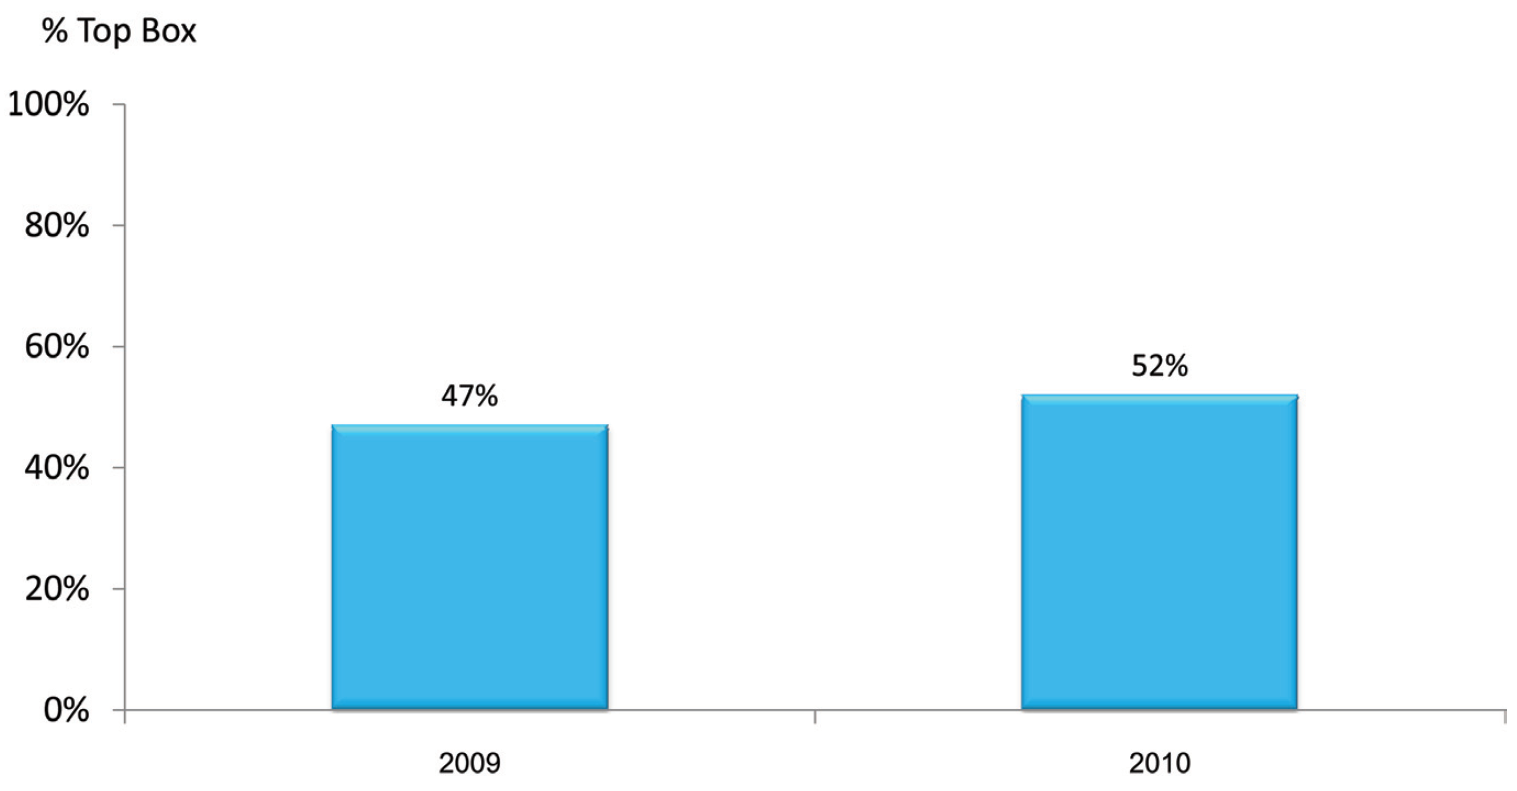
Figure 9: Annual average HCAHPS total top (top box) scores of BMC in 2009 and 2010.
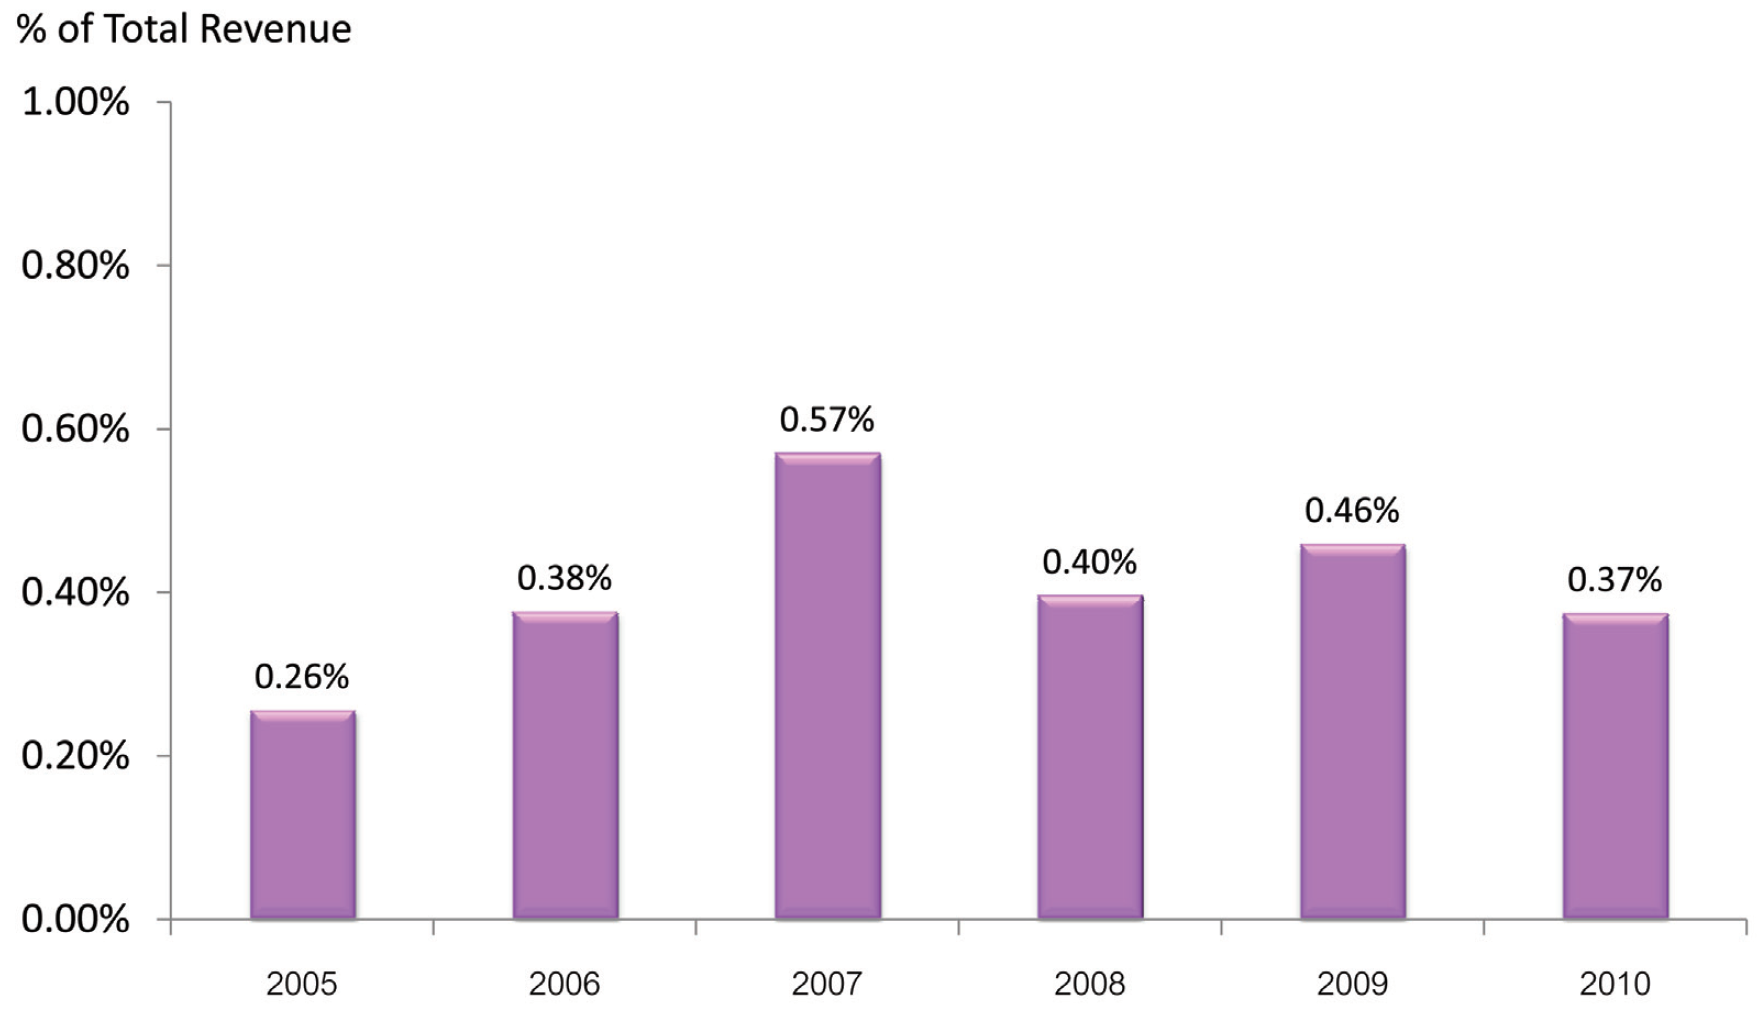
Figure 10: Annual cost of risk management versus total revenue from 2005 to 2010
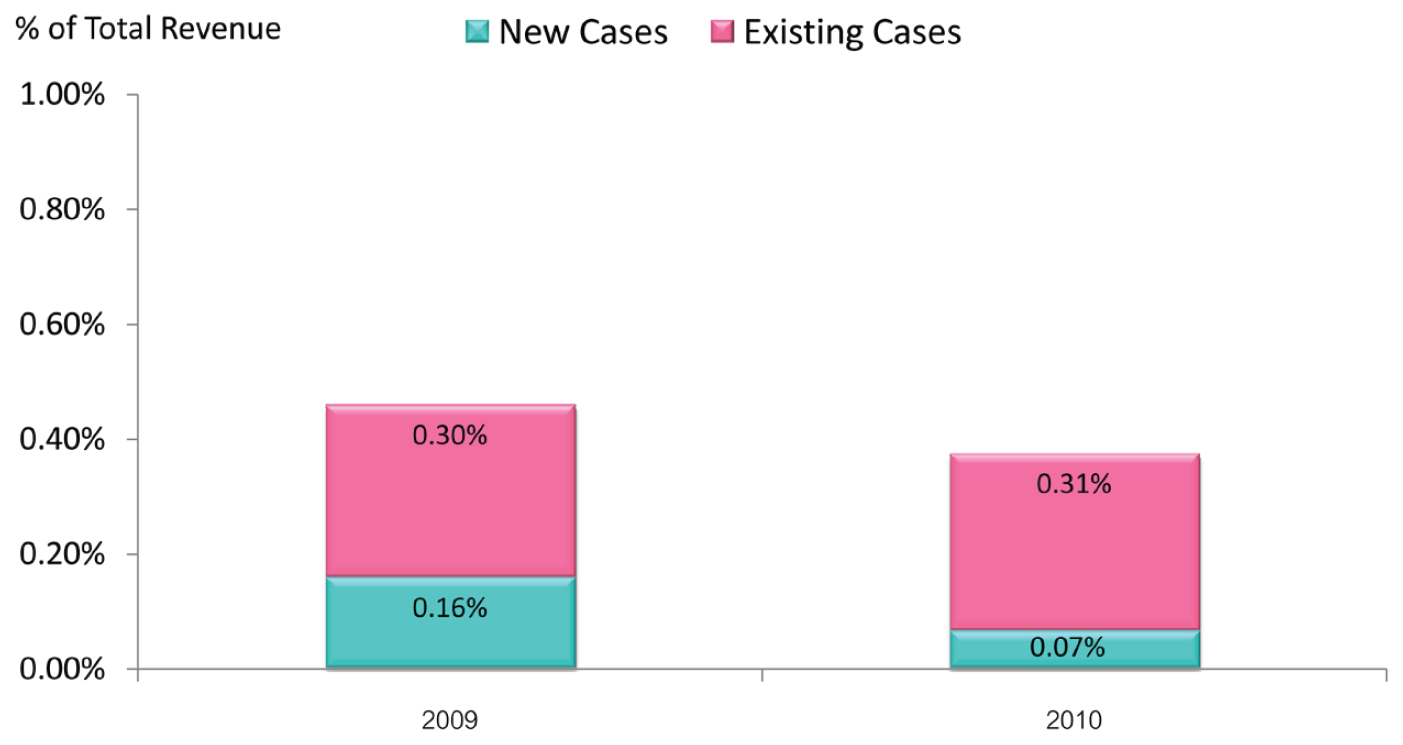
Figure 11: Cost of risk management by case type versus total revenue in 2009 and 2010
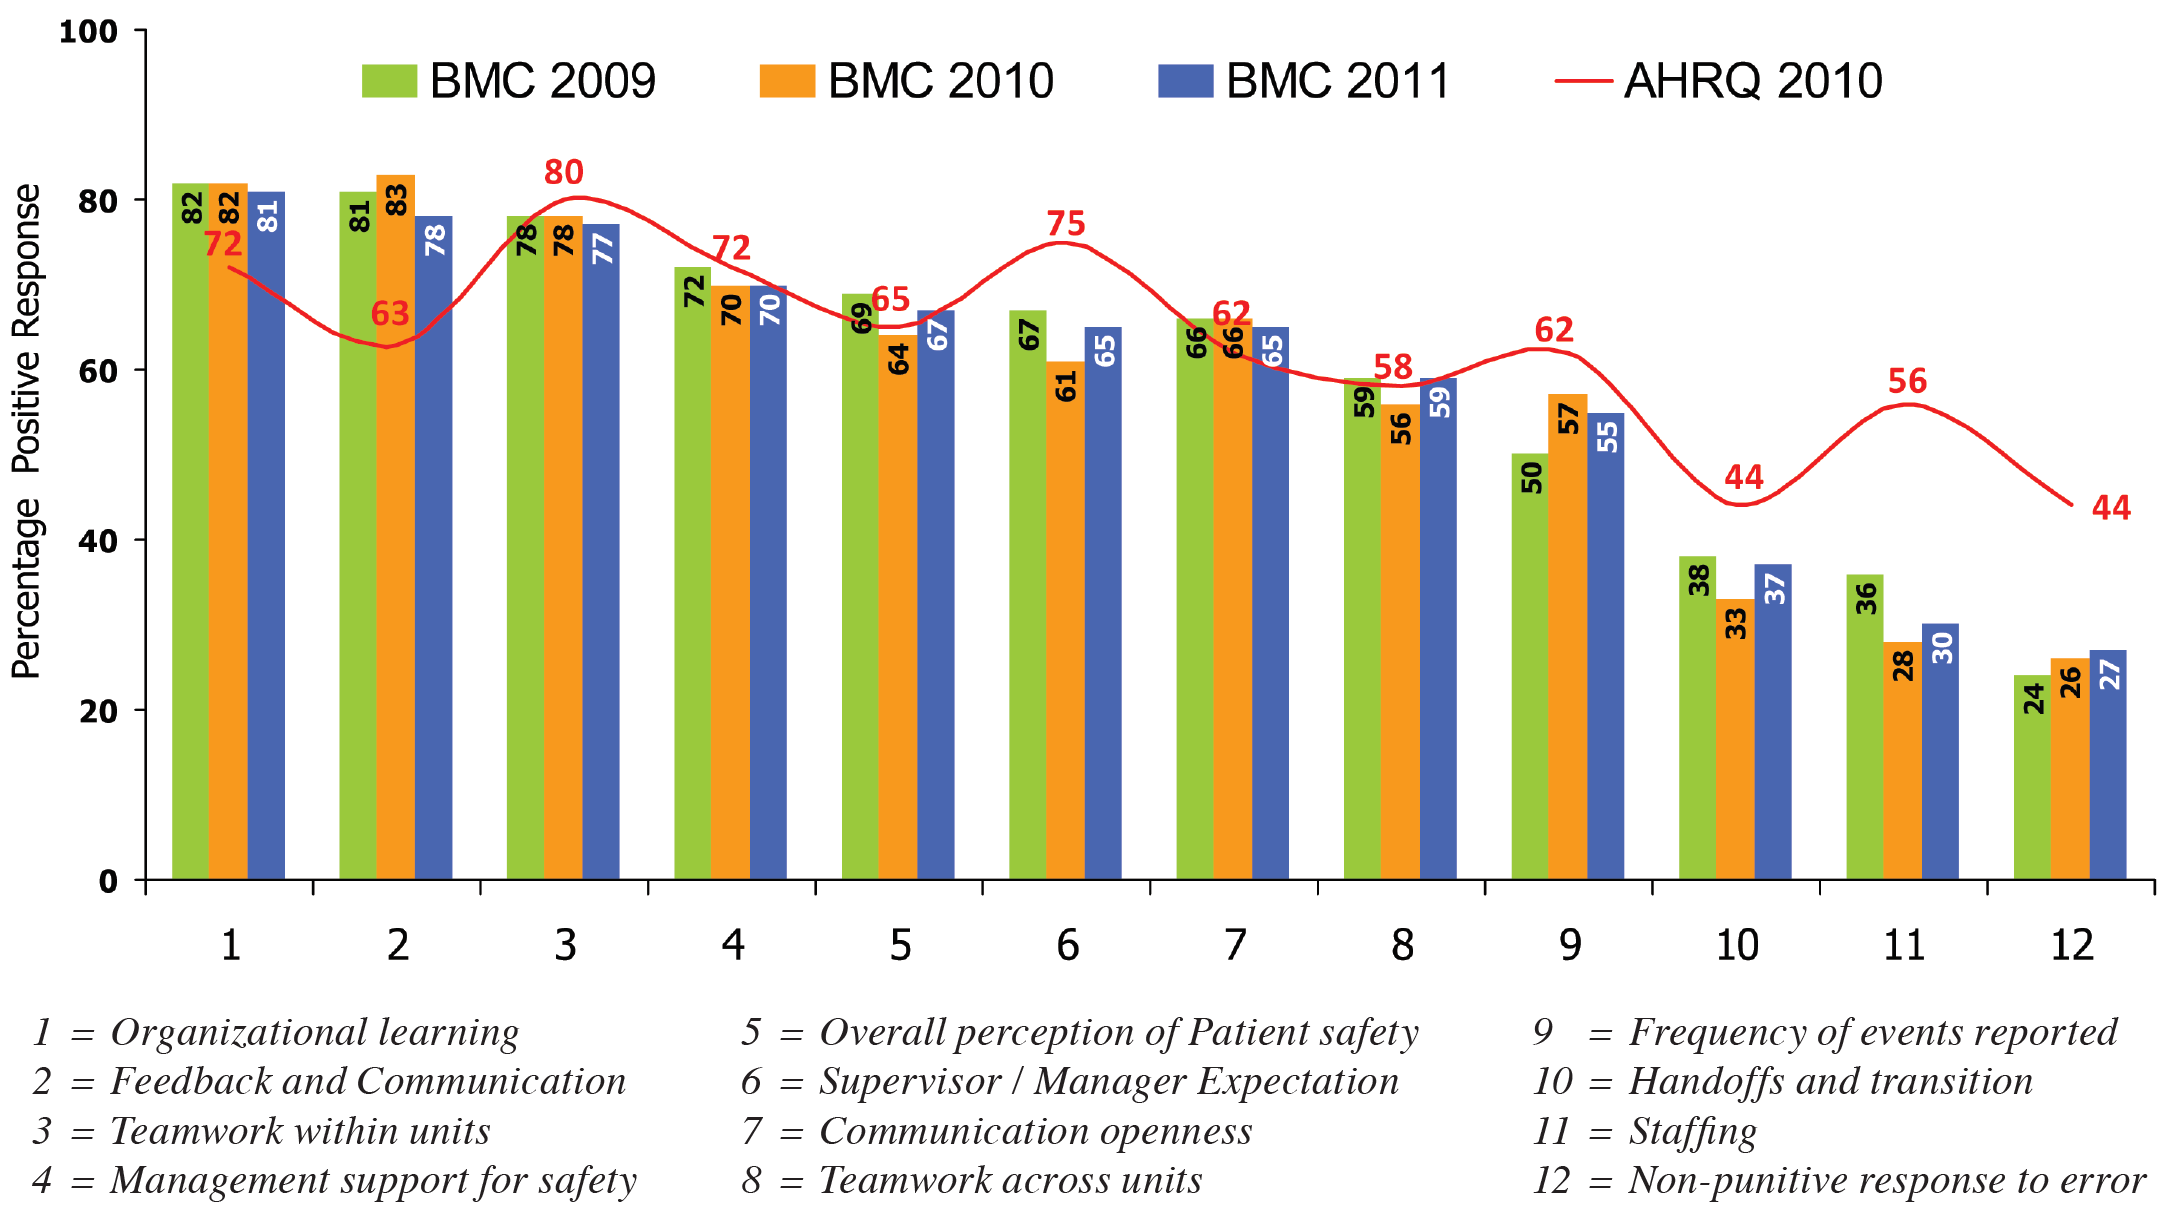
Figure 12: Employees’ Opinions on BMC’s Safety Culture versus AHRQ Benchmarks from 2009 to 2011
An independent factor is found in the Thai legal environment of the Consumer Protection Act2 , which allows consumers to petition for compensation from the consumer court for any adverse event. This factor could have negatively impacted the cost of risk management in PSRM program. To prevent this factor, in 2009, BMC started its Emotional Risk Management program. After implementation of the program, we discovered that the retrospective risk management costs in new cases declined significantly; from 0.16% of total revenue in 2009 to 0.07% in 2010 (Figure 11). Meanwhile the long-term expenses of the existing cases in both years (approximately 0.30% of total revenue) remained relatively constant (Figure 11). This resulted in a declining trend of total cost of risk management at BMC (Figure 10).
5. Patient Safety Culture at BMC
To make sure BMC had created a culture of patient safety, BMC surveyed its employees from 2009 to 2011 on their perception of the BMC’s patient safety culture. The findings were compared with the benchmarks from the United States–based Agency for Healthcare Research and Quality (AHRQ). The survey showed that staff believed BMC’s culture was conducive to learning and communication in patient safety, teamwork, management support for patient safety, and overall perceptions of safety; however it did not meet AHRQ benchmarks for handoffs, supervisor/manager expectations, and nonpunitive responses to errors (Figure 12).
BMC’s five-year experience in PSRM program can be summarized as follows:
The author thanks Ratchada Prakongsai and Prapimporn Worachat for data collection, analysis and preparation of figures, and also Matinee Maipang and Pravich Tanyasittisuntorn for helpful comments on an early draft of the work. This work would not have been possible without their help.