Electronic ISSN 2287-0237
Late gadolinium contrast enhancement (LGE) MRI has already been established as a gold standard diagnostic technique for detecting the presence of abnormal increasing myocardial extracellular volume (ECV) such as myocardial fibrosis. However, T1W LGE MRI technique still has some difficulties in diagnosing diffuse myocardial fibrosis that creates a non-significant contrast difference between the local gadolinium accumulated fibrosis and the adjacent myocardial tissue results in which the whole left ventricular myocardium is globally nulled. There have been many attempts to research for other techniques to fix this drawback. This article proposes an optional technique which has potential to be used as complementary to LGE MRI in diagnosing myocardial disease involving increasing myocardial extracellular volume. T1W LGE MRI has already been established as a unique and gold standard diagnostic technique for detecting the presence of abnormal increasing myocardial extracellular volume (ECV) such as myocardial fibrosis.1 This article proposes an optional technique to rely on the T1W BB (black blood) signal intensity difference ratio analysis between pre- and post- contrast in detecting focal increasing myocardial extracellular volume. The concept of our technique comes from the basic knowledge of 1) the native T1W BB signal intensity that is influenced by T1 time of tissue proton. The larger the H1 protons, the larger the signal intensity.2 2) accumulated gadolinium contrast in the ECV will shorten T1 time of water protons in the ECV in proportion to its local concentration and increase signal intensity and it is still the water protons that contribute to signal. 3) the amount of ECV correlates to the distribution of accumulated gadolinium contrast.3 4) the etiologies of increasing extracellular volume are extracellular edema (e.g. myocarditis ) or disruption of the cell membrane (e.g. infarction), 5) normal myocardial ECV is in the range of 20-30% (and comes from ECV mapping research).4 This study proposes an optional MRI technique of using the T1 signal intensity analysis in pre- and post- gadolinium contrast injection, the T1 signal intensity difference ratio>30% is a cutoff point to discriminate the focal increasing myocardial region from normal region (see diagram of conceptual study proposal). The following diagram provides a comprehensive guide of our thought in studying, proposing and evaluating the new MRI technique for detecting myocardial ECV in comparison to the gold standard ECV as mentioned above.
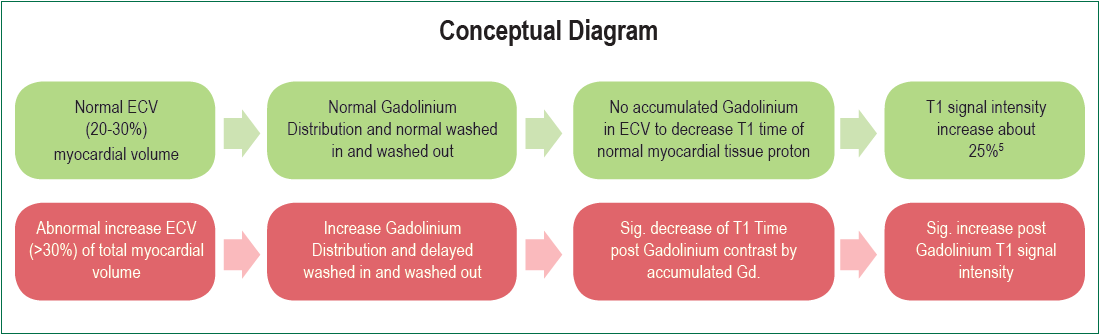
Conceptual diagram A: Normal ECV gives normal range of increasing T1W BB signal intensity (20-30%) after contrast injection 15-20 minutes
Conceptual diagram B: Abnormal ECV gives increasing T1W BB signal intensity after contrast injection of 15-20 minutes > normal range (>30%)
Definition
Myocardial fibrosis
Myocardial fibrosis is the myocardial scarring process that is caused by a cardiac injury such as ischemia, infection, inflammation or as a consequence of congenital heart disease.6 Myocardial fibrosis is characterized by fibroblast accumulation and excess deposition of extracellular matrix proteins, which causes the distortion of myocardial architecture,7 it may be reactive or a replacement. In reactive fibrosis, there is an accumulation of collagen in both perivascular and interstitial zones but there is no myocardial cell loss which is the opposite of replacement fibrosis, where there is myocyte loss. Myocardial fibrosis is in the region of increasing ECV as occurs in hypertrophic cardiomyopathy, ischemic and non-ischemic dilated cardiomyopathy, and myocarditis and arrhythmogenic RV dysplasia. The focal fibrosis region in these myocardial pathologies produces a higher signal intensity on LGE MRI image (bright signal) relative to the normal myocardial tissue after gadolinium contrast injection. That said, diffuse myocardial fibrosis does not because there is no presence of a reference normal myocardium region.8
T1W (weighted) BB (black blood) pulse sequence: T1W BB pulse sequence is the MRI pulse sequence which is used to characterize tissue type by relying on the T1 relaxation time of tissue. T1 relaxation time is a time use of excited nuclei in returning from the high energy state to the low energy ground state. T1 time also indicates how fast the spinning nuclei takes to emit their absorbed radiofrequency pulse (RF) into the surrounding tissue or lattice. Short T1 time indicates slow molecular motion of that tissue proton, such as fat, that regains longitudinal magnetization rapidly. Water molecules have high mobility and do not emit the absorbed RF energy to the surrounding tissue as fast as fat, therefore it takes a longer T1 time to regain longitudinal magnetization. T1 time is high in some cardiac diseases such as infarction, myocarditis, diffuse fibrosis causes, amyloidosis9 and is low in Anderson-Fabry disease and siderosis.10 Thus, T1 changes are related to excess water in edema and protein deposition.11,12 Water with poor spin-lattice energy exchange record the weakest signal (with the fewest protons being able to flip back). Thus, they will have the darkest signal.13
Late gadolinium contrast enhancement (LGE) MRI is typically performed after gadolinium (gadolinium DTPA) contrast intravenous injection for 10-20 minutes14 when there is sufficient contrast between normal and infarcted tissue.15 The physiological concept of the LGE technique relies on the distribution of gadolinium contrast agent in tissue and also the delayed wash in and washed out time that is generally longer in abnormal increasing ECV tissue region such as infarcted tissue when compared to a normal myocardial region. The higher extracellular volume (ECV) fraction regions such as infarct myocardium will have significantly higher concentrations of gadolinium contrast at the steady state than that of a normal tissue region, and will experience greater T1-shortening. The high gadolinium concentration with a greater shortening T1 myocardial region will produce a brighter signal on the LGE image and a higher SI on the T1W bb image. There is a linear relationship between the reflexivity of longitudinal magnetization (R1 = 1/T1) and the change in contrast agent concentration, ΔR1 = R1post − R1pre = γ [Gd] (γ = 4.5 L mmol−1sec−1). The relative difference of signal intensity between the local gadolinium concentration and adjacent area including the proper selection of inversion recovery time (TI) for perfect nulling of normal myocardium are important factors to consider to discriminate between normal and pathologic myocardial area.16,17 The distribution volume of gadolinium contrast correlates with the amount of myocardial extracellular volume. The differentiation of specific myocardial pathology involving increasing ECV is determined by the presence of a bright signal of local gadolinium accumulation tissue of the myocardium region and also the distribution pattern of a bright signal on the LGE image. Besides being used in detecting necrotic and fibrotic scar tissue in myocardial infarction it has already been applied for other myocardial cardiomyopathies because the different types of myocardial disease produce a different pattern of contrast enhancement. LGE MRI has been considered as a highly sensitive and reproducible MRI technique in qualitative and quantitative assessments for myocardial fibrotic scarring, however it still has limitations when it comes to assessing diffuse myocardial fibrosis as mentioned above.18 Gadolinium based contrast is an extracellular and water soluble contrast agent. After injection, gadolinium is initially distributed into the intravascular space and rapidly diffuses across the vascular membrane into the interstitial (extracellular) space and is then excreted via renal glomeruli and about 10-15 minutes after injection. Gadolinium contrast in the body goes into the equilibrium phase and the gadolinium contrast redistributes into the interstitial space. Due to its paramagnetic properties, gadolinium contrast can facilitate both longitudinal and transverse magnetic relaxation by shortening both T1 and T2 of tissues in which it accumulates. The shortening effect of gadolinium on T1 and T2 tissue time depends on the baseline relaxation time of the tissue before contrast injection and the concentration of contrast accumulation in tissue after injection. Although gadolinium contrast does shorten both T1 and T2 time the accumulation contrast in tissue extracellular space has an effect on T1 predominately. Gadolinium contrast has an effect on the T1 signal by increasing the T1 signal intensity in parallel with shortening the T1 time of myocardium. Gadolinium diffuses from the vessel into the extracellular space and accumulates in the increased ECV region. This accumulation does not happen in normal myocardium. The time delay after gadolinium contrast injection can determine the ECV size, the different time delay can cause a different ECV size hence this is a drawback of the LGE MRI. In addition, LGE MRI technique still has difficulty in detecting diffuse myocardial ECV disease due to the lack of the real normal reference myocardium and the limitation of the spatial resolution of LGE images.20
A retrospective analysis was conducted for a pilot of a total of 14 patients with known and suspected myocardial disease who underwent a CMR scan at Bangkok Heart Hospital, Bangkok, Thailand during September 2016-April 2017. Late gadolinium contrast enhancement (LGE) MRI and Spin echo T1W bb MRI in both pre- and post- contrast injection were performed in all patients on short axis view in the same slice position and number of slices. The myocardial signal intensity measurement on the T1W bb in both pre- and postcontrast injection images were acquired on short axis view at the same region of interest (contrast enhancement region and negative enhancement) on LGE MRI images. T1 signal intensity difference ratio between pre- and post- contrast were calculated in both LGE positive and negative groups. The mean T1W BB signal intensity difference ratio value > 30% was classified as abnormal increased ECV myocardium. The results of the new MRI technique related to T1W BB signal intensity difference ratio value > 30% in detecting the focal abnormal increased ECV myocardial region was compared to the gold standard LGE MRI in terms of sensitivity, specificity and accuracy. For accuracy comparison, chi-square test was used and p
Cardiac MR imaging techniques
Step 1-4: “Guide to go map”
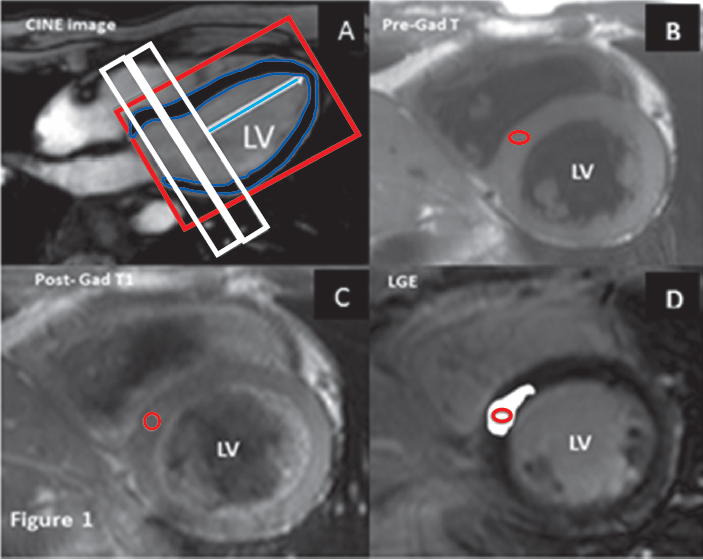
Figure 1A-D: “guide to go” demonstration of MRI imaging steps for T1W BB SI difference ratio analysis
Step1 (A): Perform gradient echo CINE MRI pulse sequence on 4- chamber view as a reference image for short axis view.
Step2 (B): Perform T1W BB spin echo pulse sequence pre-contrast on short axis view with whole heart coverage or covers region of interest.
Step3 (C): Perform T1W BB spin echo pulse sequence after gadolinium injection for 15-20 minutes contrast on short axis view with whole heart coverage or covers region of interest in the same protocol (locator location, number of slices, gap between slice and all MRI parameters) as pre-contrast T1.
Step4 (D): Perform 3D LGE MRI (multiple slices with single breath hold) after gadolinium injection for 15-20 minutes contrast on short axis view with whole heart coverage or covers region of interest in the same protocol (locator location, number of slices, gap between slice and all MRI parameters) as T1W BB pulse sequence. Bright white region on Figure 1D represents the late contrast enhancement region
Image and statistical analysis
The SI difference ratio (SDR) between post- and precontrast T1 [(post contrast T1 SI, pre-contrast T1 SI) / post contrast T1 SI x100%] is considered as normal range if <30%, and is considered as abnormal increasing ECV if the SDR >30%. We compared our new technique with LGE in detecting myocardial region with abnormal increasing ECV (e.g. fibrosis, necrosis, and edema) and normal myocardial region with the gold standard LGE in terms of sensitivity, specificity and accuracy. Chi square test was used to assess the accuracy of the new technique compared to the LGE MRI, p
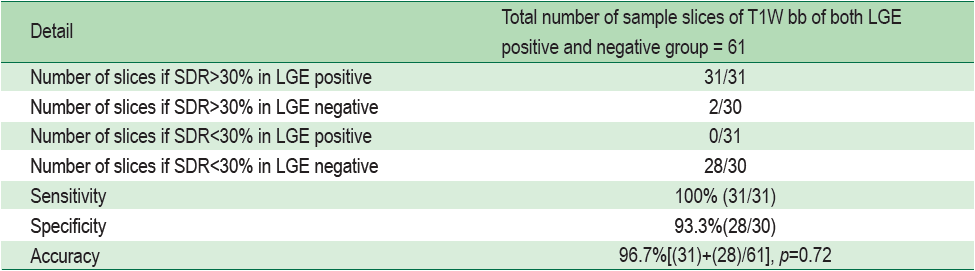
A total of 61 samples of T1 short axis slices of each T1 pre- and post- contrast were obtained from all patients, 31/61 were of diseased myocardium with LGE positive and 30 were normal myocardium with LGE negative. The mean T1 signal intensity difference ratio between pre- and post- contrast were evaluated in both LGE positive and negative groups. The mean signal intensity difference ratio > 30% was classified as abnormal increased ECV myocardial region. The T1 signal difference ratio> 30% was found in 2/30 slices of LGE negative group and 31/31 slices of the LGE positive group. The mean value of T1 signal difference ratio of normal and diseased myocardium were 19.13±7.5 % and 41.4±7.6% respectively. The sensitivity and specificity and the accuracy of T1W bb difference ratio > 30% in differentiating normal from myocardium involving increasing ECV were 100%, 93.3% and 96.7% with p = 0.72 consecutively compared to the LGE. The results also show a lower pre-contrast native T1 signal intensity in the LGE positive group when compared to the LGE negative group.
Table 1. Demographic data (n=14)
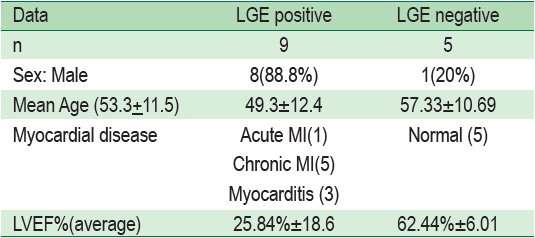
Table 2 Results of T1W bb SI difference ratio analysis
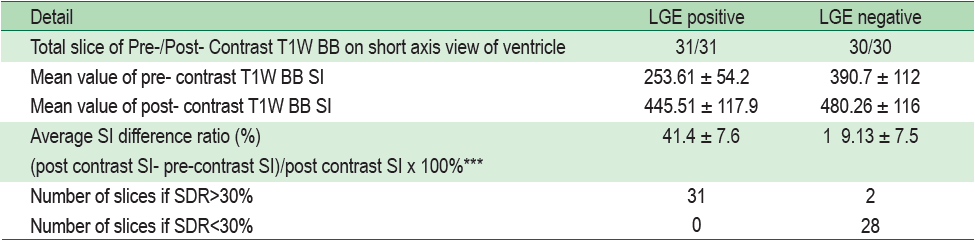
Table 3: Studied technique and statistical assessment method of the new technique
Case # 1: Normal patient (Figure 2A-B)
A 62-year old woman came to the hospital for an MRI scan with gadolinium contrast injection to rule out left atrial appendage and left ventricular clot. CINE MRI on horizontal and vertical long axis view and also on short axis view were done for cardiac structure assessment and ventricular function respectively and they showed LVEF of 58 % with no regional wall motion abnormality. First pass rest perfusion study scan with contrast injection was performed and showed no myocardial ischemia at rest. After 15 minutes of gadolinium injection, delayed contrast enhancement was done and showed no myocardial contrast enhancement that indicated no prior myocardial fibrosis. The T1W BB was performed in pre- and post- contrast injection for myocardial signal intensity (SI) measurement.
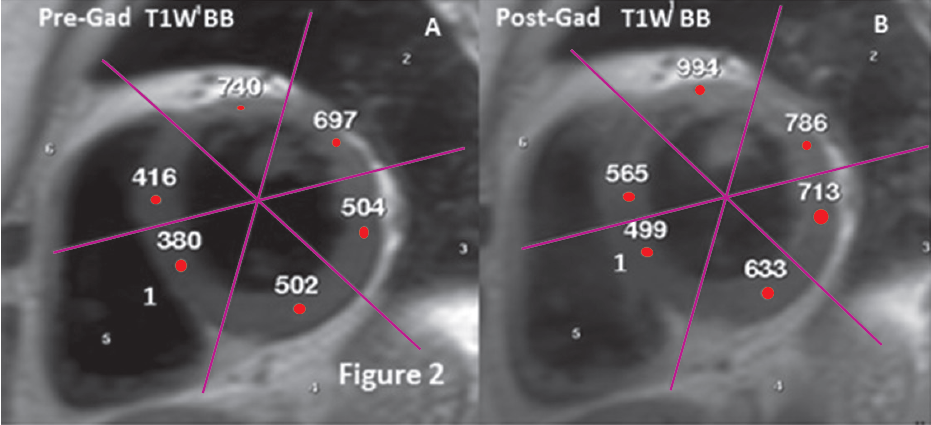
Figure 2A-B: normal patient case: Demonstration of the T1 signal intensity ratio between pre-Gd T1W BB SI and post Gd T1W BB SI <30% in all myocardial regions that indicate no abnormal increasing ECV [e.g. region 1 , SDR= (Post- contrast T1 SI (499) -Pre- contrast T1 SI (380)/ Post- contrast T1 SI (499) x100) = 23.8%]
Case # 2: Chronic myocardial infarction (Figure 3A-C)
A 43-year old man presented with a history of chest pain. Cardiac CINE MRI revealed severe LV systolic dysfunction with LVEF of 11%. Late gadolinium contrast enhancement MRI showed subendocardial myocardial contrast enhancement at the basal through mid LV anterior, antero-septal, inferior, infero-septal and entire apical LV with transmural extension of 70-100% as shown. This case showed an increase in myocardial signal intensity on T1W BB post contrast image in the same region of contrast enhancement on LGE MRI image.
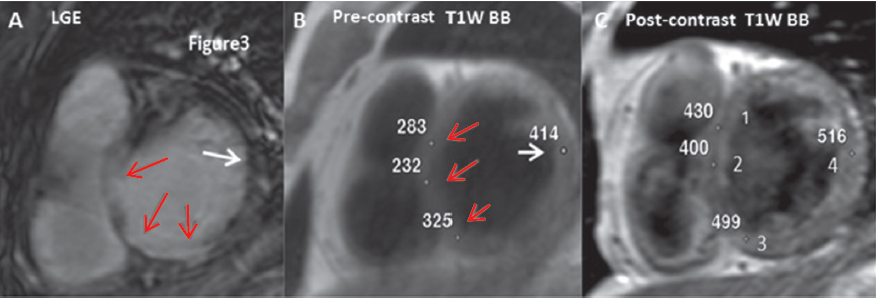
Figure 3A-C: chronic myocardial infarction case shows the calculated results of difference ratio between pre-Gd T1 SI and post Gd T1 SI >30% in myocardial infarction region 1,2,3 segments on T1W BB images that indicate an abnormal increase of ECV. The results are compatible with contrast enhancement region shown on LGE MRI image that indicates fibrosis of prior myocardial infarction [e.g. region 2 , SDR= (post- contrast SI -pre-contrast SI)/post- contrast SI x 100%) = (400-232/400x100%)=42% and at the myocardial region with negative contrast enhancement, region 4 (white arrow sign on LGE MRI image), SDR= (516-414 /516x100%)=19.7% ]. A: LGE MRI image shows myocardial infarction (red arrows), Normal region (white arrow), B: Pre-contrast T1W BB image, C: Post- contrast T1W BB image, 2= region 2, 4= region 4
Case # 3: Acute myocarditis (Figure 4A-C)
A 37-year old woman came to the hospital with a history of chest pain starting 2 weeks prior with low grade fever and clinical left heart failure. Blood troponin I level was of 4703.5 ng/L (normal level
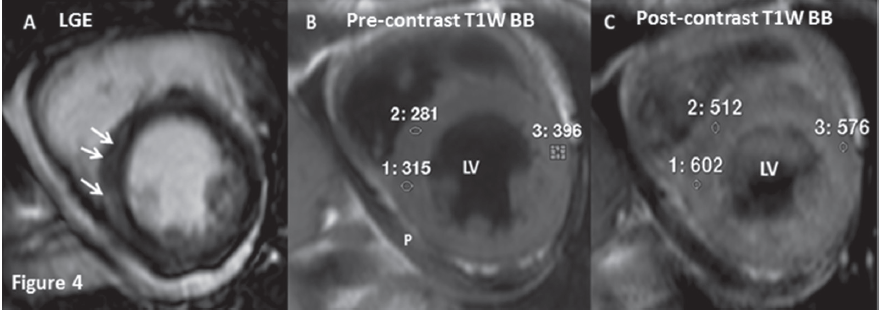
Figure 4 A-C: acute myocarditis case reveals the difference ratio between pre-Gd T1 SI and post Gd T1 SI >30% in LV infero-septal wall [e.g. region 1 (positive LGE ) , (SDR=post- contrast SI - pre-contrast SI)/post- contrast SI x100%)=(602-315/602x100%)=47.6%] that indicates an abnormal increase of ECV which is compatible with contrast enhancement on LGE image (white arrow), at the negative LGE (region3) [SDR=(576-396)/576x100%)=31.5%]. The result of SI difference ratio of >30% is found in LGE positive region (region 1) and LGE negative region (region 3) indicates a diffuse abnormal increasing ECV that is compatible with diffuse expansion myocardial edema of acute myocarditis. A: LGE MRI image shows sub-epicardial myocardial contrast enhancement (white arrow) that is suggestive of myocarditis. B: Pre-contrast T1W BB image. C: Post- contrast T1W BB image , 1= region 1, 3= region 3, P= pericardial effusion
Case # 4: Acute myocardial infarction with post PCI and stenting at the mid LAD 5 days before MRI scanning (Figure 5A-C)
A 58-year old came to the hospital with prior acute ST elevation myocardial infarction with ruptured VSD 1 week prior. Twelve leads ECG shows Q wave with ST elevation in lead V1-V6. CAG showed 90% stenosis of the mid LAD. Adhoc PCI with stenting at the mid LAD was done. After PCI five days, he was sent to perform cardiac MRI with gadolinium contrast injection for viability study. LGE MRI and T1W BB spin echo pulse sequence in both pre- and post- contrast were performed. The signal intensity of myocardial on both pre- and post- contrast T1W BB images were measured at myocardial regions which was compatible with contrast enhancement region on LGE image and of the adjacent area.
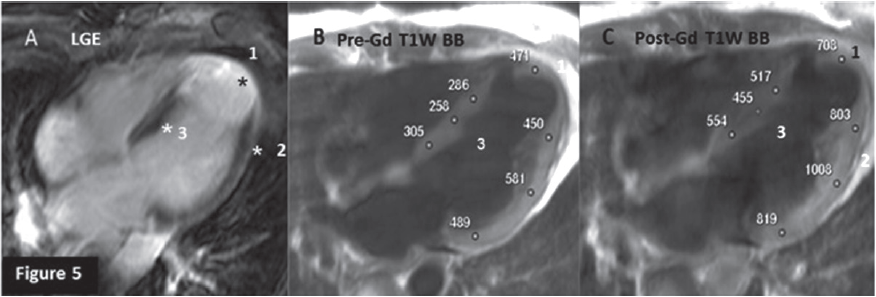
Figure 5A-C: acute myocardial infarction with post PCI and stenting case. The signal intensity difference ratio between pre-Gd T1 SI and post Gd T1 SI >30% at the infarct myocardium (region 1) [e.g. region1, SDR= (708- 471)/708x100%=33.4%] is compatible with contrast enhancement area on LGE MRI and also the adjacent area (region2,3) with LGE negative (region 2), SDR=(803- 450)/803x100%=43.9%, (region 3 ), SDR=(455- 258)/455x100%=43.3% these indicate myocardial infarction with diffuse edema. A: LGE MRI image shows myocardial infarction (white band,*, region 1). B: Pre-contrast T1W BB image. C: Post- contrast T1W BB image.
This study proposes a new MRI technique that emphasizes signal intensity (SI) of myocardium which is the end product of the spin echo pulse sequence of the T1W BB scan. We hypothesized that the displayed SI on T1W BB images will increase after gadolinium contrast injection and that this should be parallel with other measured parameters that influence myocardial SI (such as the T1 time of water proton will be theoretically shortened after gadolinium contrast injection that results in an increase of SI). It is important to mention that we are not imaging gadolinium or the protons in the chelating substance and we are not measuring the native T1 time. We do, however, measure and analyze T1W BB signal intensity before and after the effect of gadolinium contrast at the region that is compatible with the region of interest on LGE images of normal and diseased myocardium. We know that only water protons contribute to signal intensity and the components of the extracellular compartment (where gadolinium accumulates) are water and proteins. As some of the water interacts with protein, this bond makes the T1 time of the water proton in the extracellular space to become shortened. But most of the remaining water in the extracellular space is still free water which has a very long T1 and displays a dark signal. We must make it clear that the number of mobile protons in the ECV is constant in pre- and post- contrast but gadolinium contrast that has 7 unpaired electrons will interact with the water protons in the ECV and make a bonding that can alter the rotation of protons more efficiently than the protein molecule in the ECV. This interaction helps water protons to exchange energy rapidly to the lattice in the T1 time of water proton and this time is shortened significantly. Therefore the number of water protons that regain the longitudinal magnetization at the given time is increasing after gadolinium contrast injection. It can be observed that this basic principle supports our study hypothesis, the mean value of pre contrast T1W BB signal intensity in diseased myocardium with LGE positive region is lower than the LGE negative region (normal myocardium) but the value of post contrast T1W BB signal intensity is not significantly different between the two groups. The normal range of ECV in normal myocardium is around 20-30% as mentioned above and our study results also show the difference of T1W BB signal intensity between pre- and post- contrast as no more than 30% as shown in Figure 2. In the chronic myocardial infarction case (Figure 3), focal myocardial contrast enhancement on LGE is obviously shown and represents the focal area of increasing ECV causing by replacement fibrosis. The T1W BB SI in both pre- and postcontrast is measured and they give the signal intensity difference ratio >30% (region 1-3) and in the same slice, the negative LGE region (region 4) gives the signal intensity difference ratio <30%. These results confirm that the new technique is sensitive enough to be used in differentiating the focal increasing ECV region and the normal myocardial region even in the same myocardium. In the case of acute myocarditis (Figure 4) this causes global interstitial edema and may present in the sub-epicardial or scatter delayed contrast enhancement on the LGE image to indicate focal necrosis and fibrosis.19 There are focal regions with a T1W BB SI difference ratio >30% at the contrast enhanced region and non-enhanced region as shown in Figure 4. These results show the potential of the T1W BB with a signal intensity difference ratio >30% which can be used to detect the diffuse increasing ECV with no presence of delayed contrast enhancement. In the case of myocardial infarction as shown in Figure 5, regions 2 and 3 are negative for late contrast enhancement but the SI difference ratio >30% is given. Therefore, we can make the diagnosis of acute myocardial infarction with global myocardial edema.
The new cardiac MRI technique related to the T1W BB signal intensity difference ratio between pre- and post- gadolinium contrast injection >30% can be proved as a potential technique in detecting focal increasing myocardial ECV region (such as necrosis, fibrosis and edema) compared to LGE MRI in high sensitivity (100%) , high specificity (93.3%) and high accuracy (96.7% , p =0.72). The advantages of our technique are 1) having the potential to detect myocardium region with abnormal increasing ECV, 2) can be used as a complementary tool to LGE MRI to detect diffuse increasing myocardial region that otherwise might not detected by LGE MRI alone, 3) is very convenient and can be performed in any MRI platform (1.5 and 3.0 T) because it uses the basic pulse sequence spin echo T1W BB and the diagnostic protocol is performed in self- comparison to the same MRI protocol between pre- and post- contrast, 4) the diagnostic cutoff point is the percentage range thus any systematic biases may be cancelled, and 5) may have the potential to be extended in use for diffuse myocardial fibrosis in which LGE MRI cannot detect but the effect of gadolinium contrast in shortening T1 relaxation time still exists regardless of focal or diffuse increasing of ECV.
The limitation of the study is that it is a small study population and the measured SI value is sensitive to motion artifact and imperfect shimming and the length of delayed time after contrast injection. Therefore further improvements to the protocol of our technique is needed for better use.
The authors declare that there is no conflict of interests regarding to the publication of this article