Electronic ISSN 2287-0237
The prevalence of malnutrition in one study in a United Kingdom hospital is about 11-44% and it is increasing to 29-61% in the elderly.1 The risk of undernutrition and malnutrition range from loss of appetite, decreased taste buds, abnormality in digestion and malabsorption, oral care and teeth problems.2 Malnutrition also affects the immune system, the healing of wounds, loss of muscle mass and increased length of stay in hospital.3-6 Nutrition screening in the elderly is important and those who are at risk of malnutrition should be detected early in order to provide appropriate nutritionsupport in time. Adam et al.4 reported that medical staff, including doctors and nurses, were concerned about malnutrition in only 19 percent of the total at risk patients in the hospital. Usually, the process to screen for risk of malnutrition takes a lot of time and it is difficult to do because there are a lot of factors: history of body weight, weight change in the past 6 months, body mass index, anthropometry, nutrition chemical data and dietary history. A Mini Nutritional Assessment (MNA) is developed to screen malnutrition in the elderly and it is reported that the MNA is related to malnutrition.5 MNA has been accepted by 71.3% of dietitians, but is only used to screen malnutrition in the elderly in around 20% of cases,6 as MNA takes a lot of time (average 15 minutes per person) and is not always easy to measure arm and calf circumference. Mostly, the elderly have no data of current body weight (54.1%) nor of height (25.9%) because they cannot be weighed or stand.7 In Thailand, Elimitus Professor Comindr S. has developed the Nutrition Alert Form (NAF) which is easy to use and can screen nutrition status in people who do not have body weight by total lymphocyte (commonly blood test) or serum albumin. NAF has been accepted by the Asian Pacific Journal of Nutrition. But, there have been no reports of the use of NAF in the elderly. Therefore, the objective of this research is to study the correlation and concordance between NAF and MNA in evaluating the nutritional status of the elderly and evaluatedthe relation between NAF, MNA and the biochemical nutrition data; pre-albumin and total lymphocyte count in order to assess acute cases of malnutrition and to detect malnutrition risk early
This cross sectional study was conducted in outpatient and inpatient elderly patients at Bangkok Hospital from February to September 2015. The sample size in this study was calculated from 30 participants in the pilot study by kappa coefficient analysis, with a total of 153 participants aged more than 60 years old. All participants consented to take part before they were enrolled this study. The protocol was approved by the IRB of Bangkok Hospital. Inclusion criteria were patients aged more than 60 years with a known weight and height for calculated body mass index (important data needed to complete the MNA screening form). For inpatient participants, we collected data only from newly admitted inpatients. Exclusion criteria were end of life patients.
The data were collected from the inpatient and outpatient longevity unit. All longevity nurses have been trained in how to use MNA and NAF. After that, nurses were validated by a clinical dietitian before the study began.
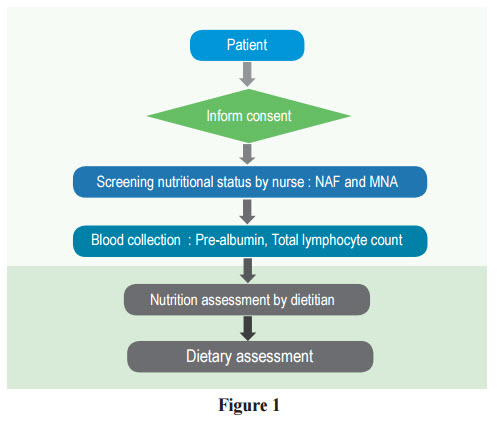
The participants enrolled in the study were screened for nutrition status by a longevity nurse with both MNA and NAF screening and blood serum pre-albumin was collected. Then, the dietitian visited participants for a nutrition assessment that included recalled dietary habits, the reason of weight change as shown in Figure 1.
MNA and NAF were categorized by a total score into normal nutritional status and malnutrition risk. MNA composed a screening part and an assessment part. The total score in the screening part is 14. If the score is less than a score of 12 (risk of malnutrition), then the nutrition assessment part should be conducted. A sum of scores amounting to less than 24 is defined as risk of malnutrition.5 NAF defines risk of malnutrition as a score higher than 78 Pre-albumin is a result of a laboratory test indicating malnutrition, and this was updated rather than albumin. Its half-life was only 3 days and was defined as malnutrition when prealbumin was less than 15 g/dL.9 The values of pre-albumin and total lymphocyte changed when there was a malnutrition status in the early stage.10-12
Statistical analysis of this study used SPSS (Statistical Package for Social Science) version 19.0. The demographic data included gender, age, weight, height, and body mass index. The anthropometry data and nutrition chemical data were presented by descriptive data analysis, mean and standard deviation. Kappa index was employed to analyze the agreement between NAF and MNA. The nutritional status data from NAF and MNA is dichotomous variable, so the analysis used was non-parametric. The correlation between malnutrition risk: NAF and MNA, NAF and serum prealbumin, NAF and total lymphocyte count were analyzed by Spearman’s rank correlation coefficient.
According to the data collected from 153 samples, 34 cases were inpatients and 119 cases were outpatients, and 34% were male while 66% were female. The mean age was 69.8 ± 8.5 years old with a body mass index was 24.5 ± 3.7 kg/m2 ;Haematocrit was 39.1 ± 8.5 %, and Hemoglobin was 13.1 ± 1.6g/dL. The results of the laboratory test; pre-albumin was 23.3 ± 6.1 g/dL and the lymphocyte was 2030.5 ± 805.9 cells percubic meter as shown in Table 1.
The result of the Kappa index between NAF and MNA was K 0.563 which was considered at the moderate level with a 95% confidence level (p < 0.05). When analyzing the sensitivity and the specificity of NAF screening compared to MNA screening, it was found that NAF had the sensitivity to identify people at risk of malnutrition as same as MNA with 80.0% (95% CI;51.9-97.7), and the specificity for the identification of people with normal nutritional status compared with MNA was of 91.3 (95% CI; 85.3-95.4). For the possibility that NAF would be consistent with MNA in the diagnosis, it was found that the positive predictive value (PPV) was 50% (95% CI; 29.1-70, 9).However, the possibility that NAF screening would be consistent with MNA without negative predictive value (NPV) was 97.7% (95% CI; 93.4-99.5) as shown in Table 2.
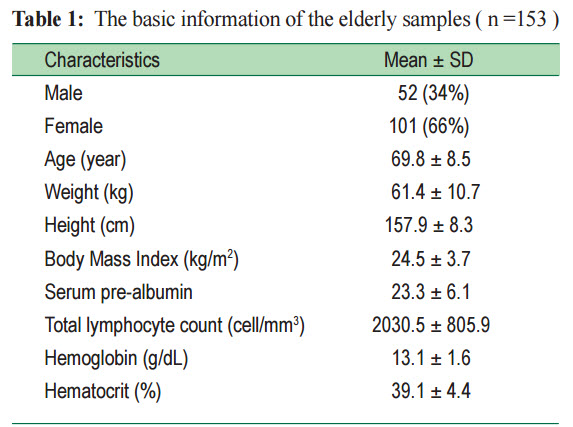
Table 2: The concordance in various aspects between Nutrition Alert Form and Mini Nutrition Assessment in nutritional status screening of the elderly (n =153)
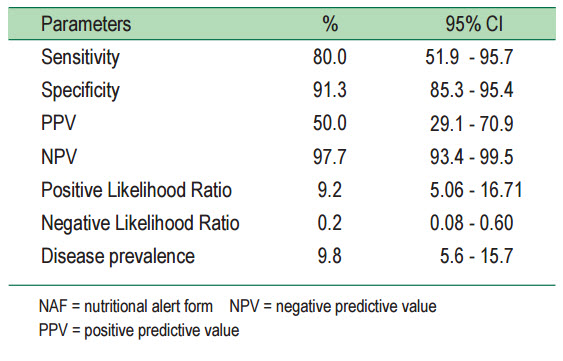
Table 3 showed the sensitivity and the specificity of malnutrition screening by NAF and MNA compared to serum pre-albumin. NAF and MNA were divided into two levels:normal nutritional status (NAF < 6, MNA from 24 and above) and at risk of malnutrition (NAF from 6, MNA < 24). Pre-albumin was used as the indicator. Table 3 showed that NAF was capable of screening in order to detect people at risk of malnutrition and when compared to pre-albumin, sensitivity was 68.8 (95% CI; 41.3-89.0). For the capability of screening in order to detect people with normal nutritional status, when compared to pre-albumin, the specificity was 90.5 (95% CI;84.3-94.9). In the case of a patient whose NAF was at risk of low pre-albumin, the positive predictive value (PPV) was 45.8 (95 % CI; 25.6-67.2), and for the case of a patient whose NAF and pre-albumin levels were normal, negative predictive value (NPV) was 96.1 (95 % CI; 91.2-98.7). When comparing the screening ability in order to detect people at risk of malnutrition by MNA in the pre-albumin, the sensitivity was 50.0 (95% CI;24.7-75.4). For the screening ability in order to detect people with normal nutritional status compared to pre-albumin, the specificity was 94.9 (95 % CI; 89.8-97.9). In the case of a patient whose NAF was at risk of low pre-albumin, positive predictive value (PPV) was 45.8 (95 % CI; 25.6-67.2), and for the chance of the person whose NAF and pre-albumin levels were normal, negative predictive value (NPV) was 94.2 (95 % CI; 91.2-98.7), (Table 3).
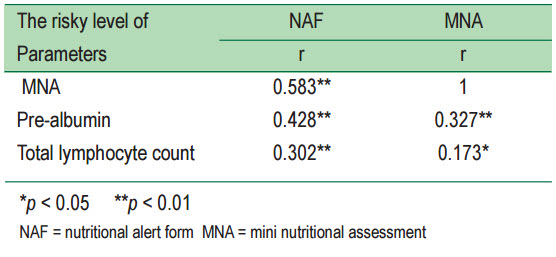
According to the analysis of the correlation of risk malnutrition by NAF and MNA compared to the nutrition biochemical data, the laboratory results determining the nutritional status (n = 153) were pre-albumin and total lymphocyte count. The risk of screening can be divided into two levels: a normal level and at risk level. The laboratory results were also divided into a normal level and an abnormal level. It was found that the risky level of NAF had a positive correlation with statistical significance at p < 0.01 with pre-albumin, total lymphocyte count and the risk level of MNA at 0.428, 0.302,0.583, respectively. The risk level of MNA was correlated positively with pre-albumin 0.327 at p < 0.01 and total lymphocyte count 0.173 statistically significant at p < 0.05 as shown in the Table 4. When analyzing the correlation of the risk level of NAF compared to MNA based on the two risk levels of nutritional screening: a normal level and a risk level, it was found that NAF had a positive correlation with MNA 0.583 that was statistically significant at p < 0.01.
Table 3: The comparison of the concordance in nutritional risk screening of the elderly in various aspects between the Nutrition Alert Form and Mini Nutrition Assessment compared to serum pre-albumin of the elderly (n = 153)
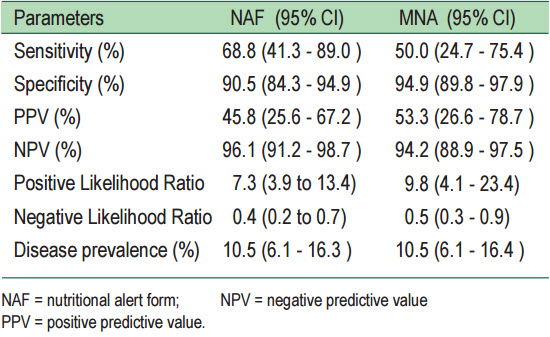
Table 4: The comparison of correlation of the risky level between Nutrition Alert Form and Mini Nutritional Assessment with Nutrition Biochemical parameter
Discussion
The result of this study revealed that the concordance of Kappa between NAF and MNA was better than previous studies assessing the concordance of MNA and other screening forms in the elderly. Alert et al.,13 found K 0.393 (p <0.001) between MNA and Geriatric Nutritional Risk Index (GNRI). Also, the study of Mette et al.,14 found the concordance between MNA and Nutrition Risk Screening 2002 (NRS) at the moderate level with K values between 0.52-0.55, and that of MNA and Malnutrition Universal Screening Tool (MUST) was in the low level, K 0.38. However, in the study of sensitivity and specificity there is no tool or screening nutritional status with 100% of sensitivity and specificity since malnutrition was a result of several factors such as body weight, a history of reduced weight,illness,15 and reduction of muscle mass, blood protein and increasing age.
Pre-albumin was the result of the laboratory test indicating malnutrition which was updated rather than albumin. Its half-life was only 3 days.9 When NAF was compared to pre-albumin,the sensitivity was higher than that of MNA. This can be explained in that pre-albumin is used to show acute nutritional status. The questions for screening of NAF were more updated than those of MNA such as current shape, the current food consumption compared with normal conditions and gastrointestinal symptoms affecting malnutrition within last two weeks.But, the questions used in MNA were most asked about the information three months ago.
According to the analysis of the correlation of risk of malnutrition by NAF and MNA compared with Nutrition Biochemical data, the laboratory results determining the nutritional status (n = 153) were pre-albumin and total lymphocyte count. The values of pre-albumin and total lymphocyte were changed when there was malnutrition status in the early stage.10-12Therefore, NAF was more consistent with the pre-albumin and total lymphocyte count than MNA. So, screening the risk of malnutrition at an early stage was likely to be beneficial for the patients. When analyzing the correlation of the risky level of NAF compared to MNA based on the two risky levels of nutritional screening (a normal level and a risky level), it was found that NAF had a positive correlation with MNA 0.583 that was statistically significant at p < 0.01 which was consistent with the previous studies on the correlation of MNA compared with other screening methods in the elderly. Rolland et al.,16 conducted a cross sectional study in the elderly older than 65 years old and found that SNAQ and MNA scores had a correlation of r 0.48 that was statistically significant at p < 0.01.
NAF was consistent with MNA at the moderate level with statistical significance. Moreover, NAF was better in screening patients with the current nutritional status when compared to pre-albumin and total lymphocyte count. When using NAF to screen for the risk of malnutrition, it was found that pre-albumin and total lymphocyte count also had nutritional risks as well. From this study NAF can be used to screen volunteers with normal nutritional status and the pre-albumin was accurately found in 96.1% of cases. But, when the nutritional status is worse and pre-albumin decreases, NAF causes more errors because the elderly patients have more nutritional risks when they get older as well as the risk of chronic malnutrition. However, screening with NAF does not recognize the importance of the increasing age of patients. Thus for accuracy of screening in the elderly, NAF should be evaluated from the perspective of age increase.
This research was partially supported by the Bangkok Health Research Center. We thank our colleagues from geriatric OPD, IPD nurses and the participant who facilitated, cooperated and gave their time to take part in this study. Especially we give thanks to Chaiyos Kunanusont, MD, and all the teams involved for their helpful contribution to this study