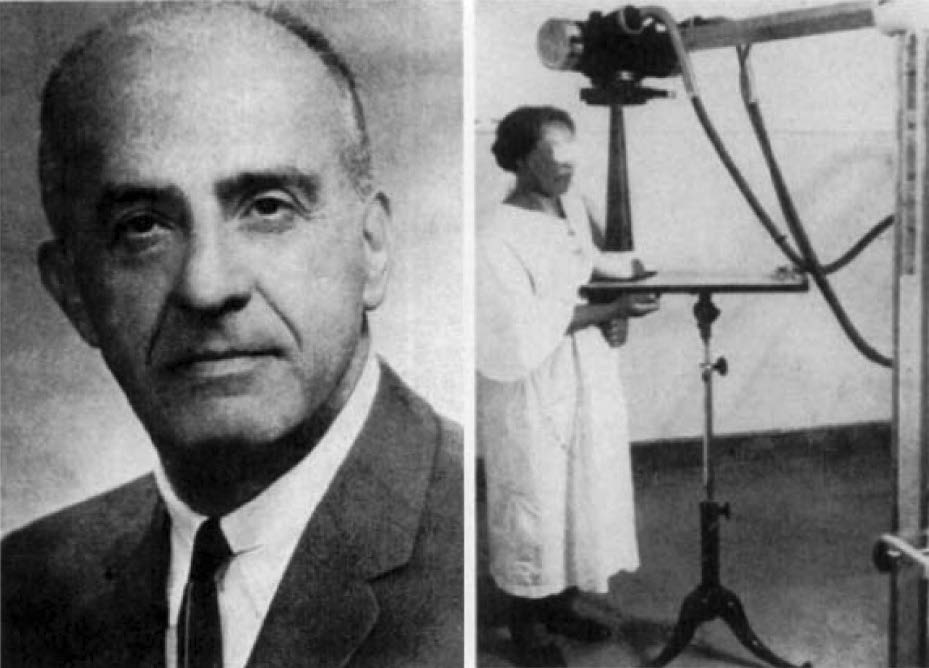
Figure 1:
Albert Salomon. (Courtesy of Andre Bruwer, MD, Tucson) Radiographic 1990;10:1111-1130
Figure 2:
Jacob Gershon-Cohen (Courtesy of Radiology) Radiographic 1990; 10: 1111-1130
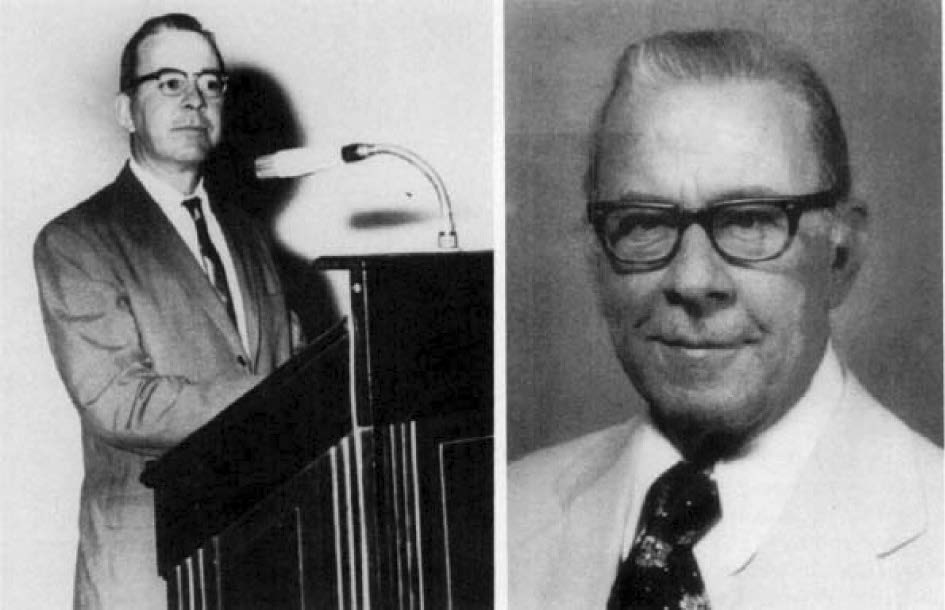
Figure 3:
Robert L. Egan, spreading the mammography gospel, in 1967 (left) and today (right). (Courtesy of Robert L., Egan, MD, Atlanta.) Radiographic 1990; 10: 1111-1130
Figure 4:
Tumor heterogeneity in a 69-year-old patient with grade I and III invasive ductal carninoma. (a) Sagittal postcontrast T1-weighted subtraction image shows heterogeneous tumor enhancement (arrow). (b-d) Computergener- ated kinetic curves obtained within the lesion show the three classic types of kinetic assessment curves: the slow persistent curve (type I) (b), plateau curve (type II) (c), and wash-out curve (type III) (d). (RadioGraphic October 2007; 27)
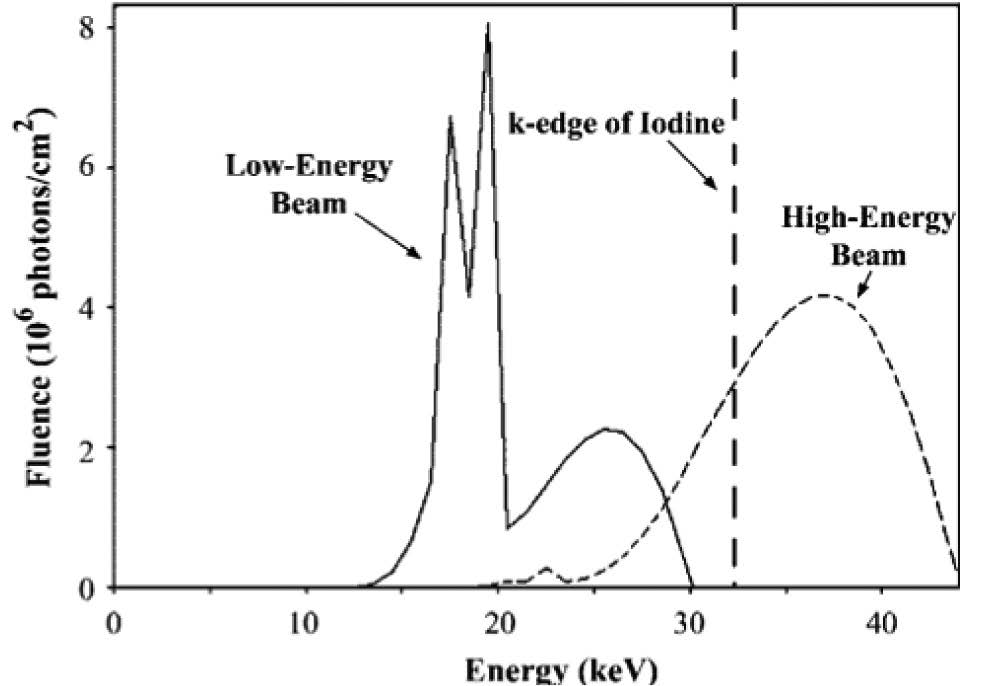
Figure 5:
X-ray spectra calculated for high and lowen- ergy beams. Each curve is scaled to represent exposure through a 4.5-cm-thick 50% glandu- lar-50% fat breast. High-energy parameters include44kVp,rhodiumanode,0.025-mm-thick rhodium and 8-mm-thick aluminum filters, and 200 mAs. Low-energy parameters include
30 kVp, molybdenum anode, 0.03-mm-thick molybdenum filter, and 140 mAs. The k edge of iodine, at 33.2 keV, is marked by a dashed line. (Modeling program courtesy of General Elec- trical Corporate Research and Development, Niskayuna, NY.) : Radiology October 2003.
Figure 6:
Invasive ductal carcinoma and DCIS. (a) Mediolateral oblique mammogram shows grouped microcalcficationin in the breast (arrows) and in lymph node (arrowhead). Enhancement is barely perceptible on postcontrast (b.) low-energy and(c) high-energy images. (d) Subtracted dual energy enhanced DSM image shows the invasive component as enhancing lesions (black arrows), but there is no definite enhancement around grouped calcifications in the posterior breast (white arrow). The malignant lymph node (arrowhead) is also enhanced. (Radiology 2003; 229:261-268)
Figure 7:
Invasive ductal carcinoma (11-mm diameter). (a) Mediolateral oblique mammogram shows possible spic- ulated mass (arrrow). (b) Dual- energy enhanced DSM image shows the cancer as an enhancing mass with definite spiculations (arrow). (Radiology 2003; 229:261-268)
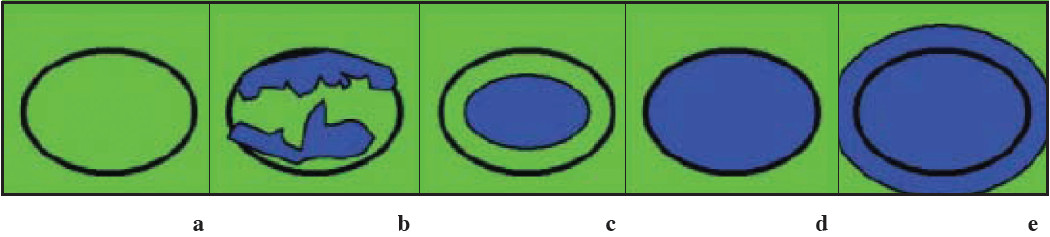
Figure 8:
Images present general appearance of lesions for elasticity scores of (a)1, (b)2, (c)3, (d)4, and (e) 5. Black circle indicates outline of hypoechoic lesion (ie, border between lesion and surrounding breast tissue) on B-mode images. (Radiology 2006;239:341-350)
Figure 9:
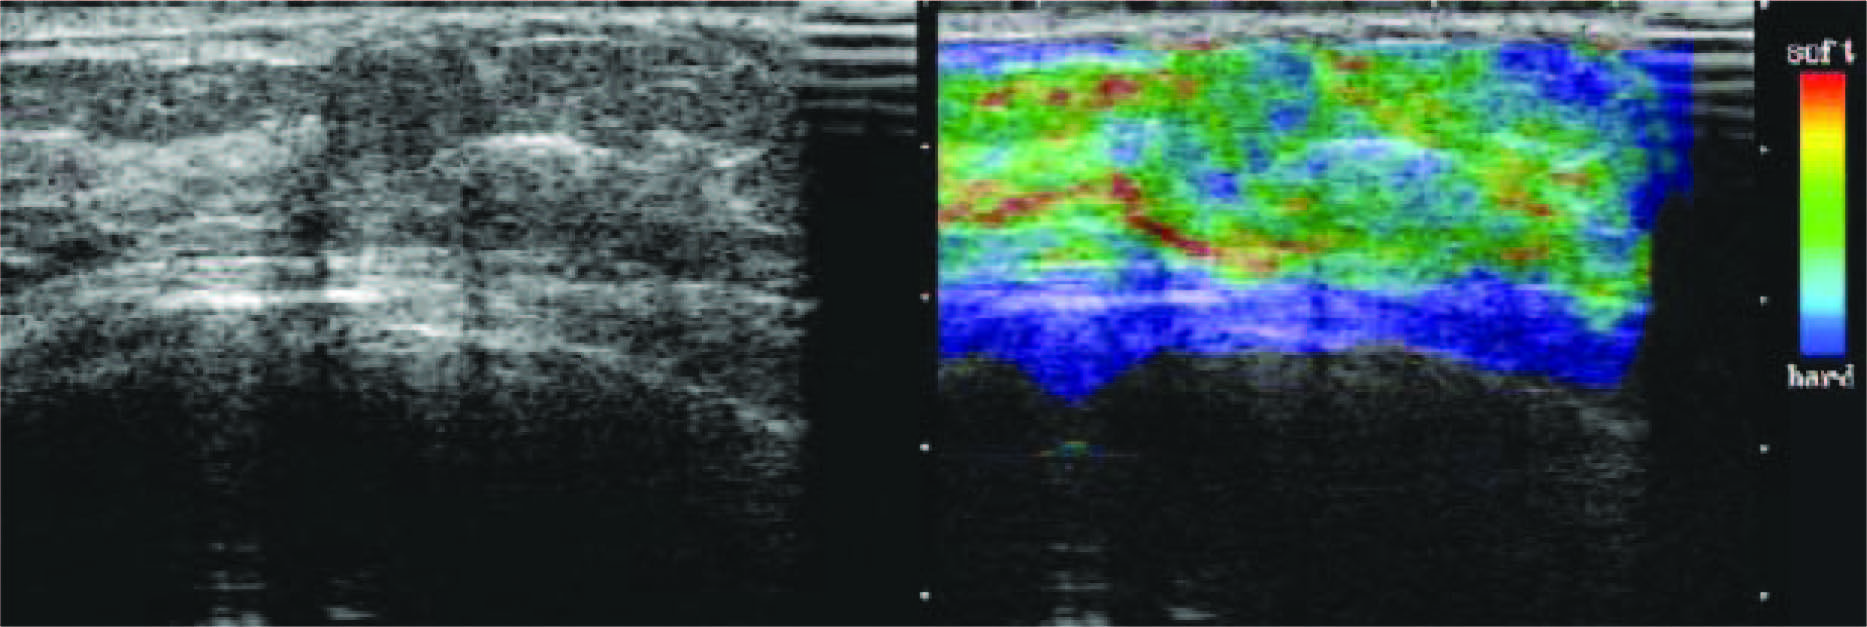
Scirrhous type invasive ductal carcinoma with elasticity score of 5 in 55-year-old woman. US images were obtained in sagittal plane. Left: On conventional B-mode images, lesion was classified as BI-RADS category 5. Middle: On elasticity image, both the entire hypoechoic lesion and its surrounding area were blue. (Radiology 2006;239:341-350)
Figure 10:
Fibroadenoma with elasticity score of 2 in 39-year-old woman. US images were obtained in transverse plane. Left: On conventional B-mode image, lesion was classified as BI-RADS category 3. Right: On elasticity image, hypoechoic lesion shows mosaic pattern of green and blue. (Radiology 2006;239:341-350)
Figure 11:
Fibroadenoma with elacticity score of 1 in 51-year-old woman. US images were obtained in transverse plane. Left: On conventional B-mode image, lesion was classified as BI-RADS cathegory2. Right: On elasticity image, the entire hypoechoic lesion was evenly shaded green, as was the surrounding breast tissue. (Radiology 2006;239:341-350)
Figure 12:
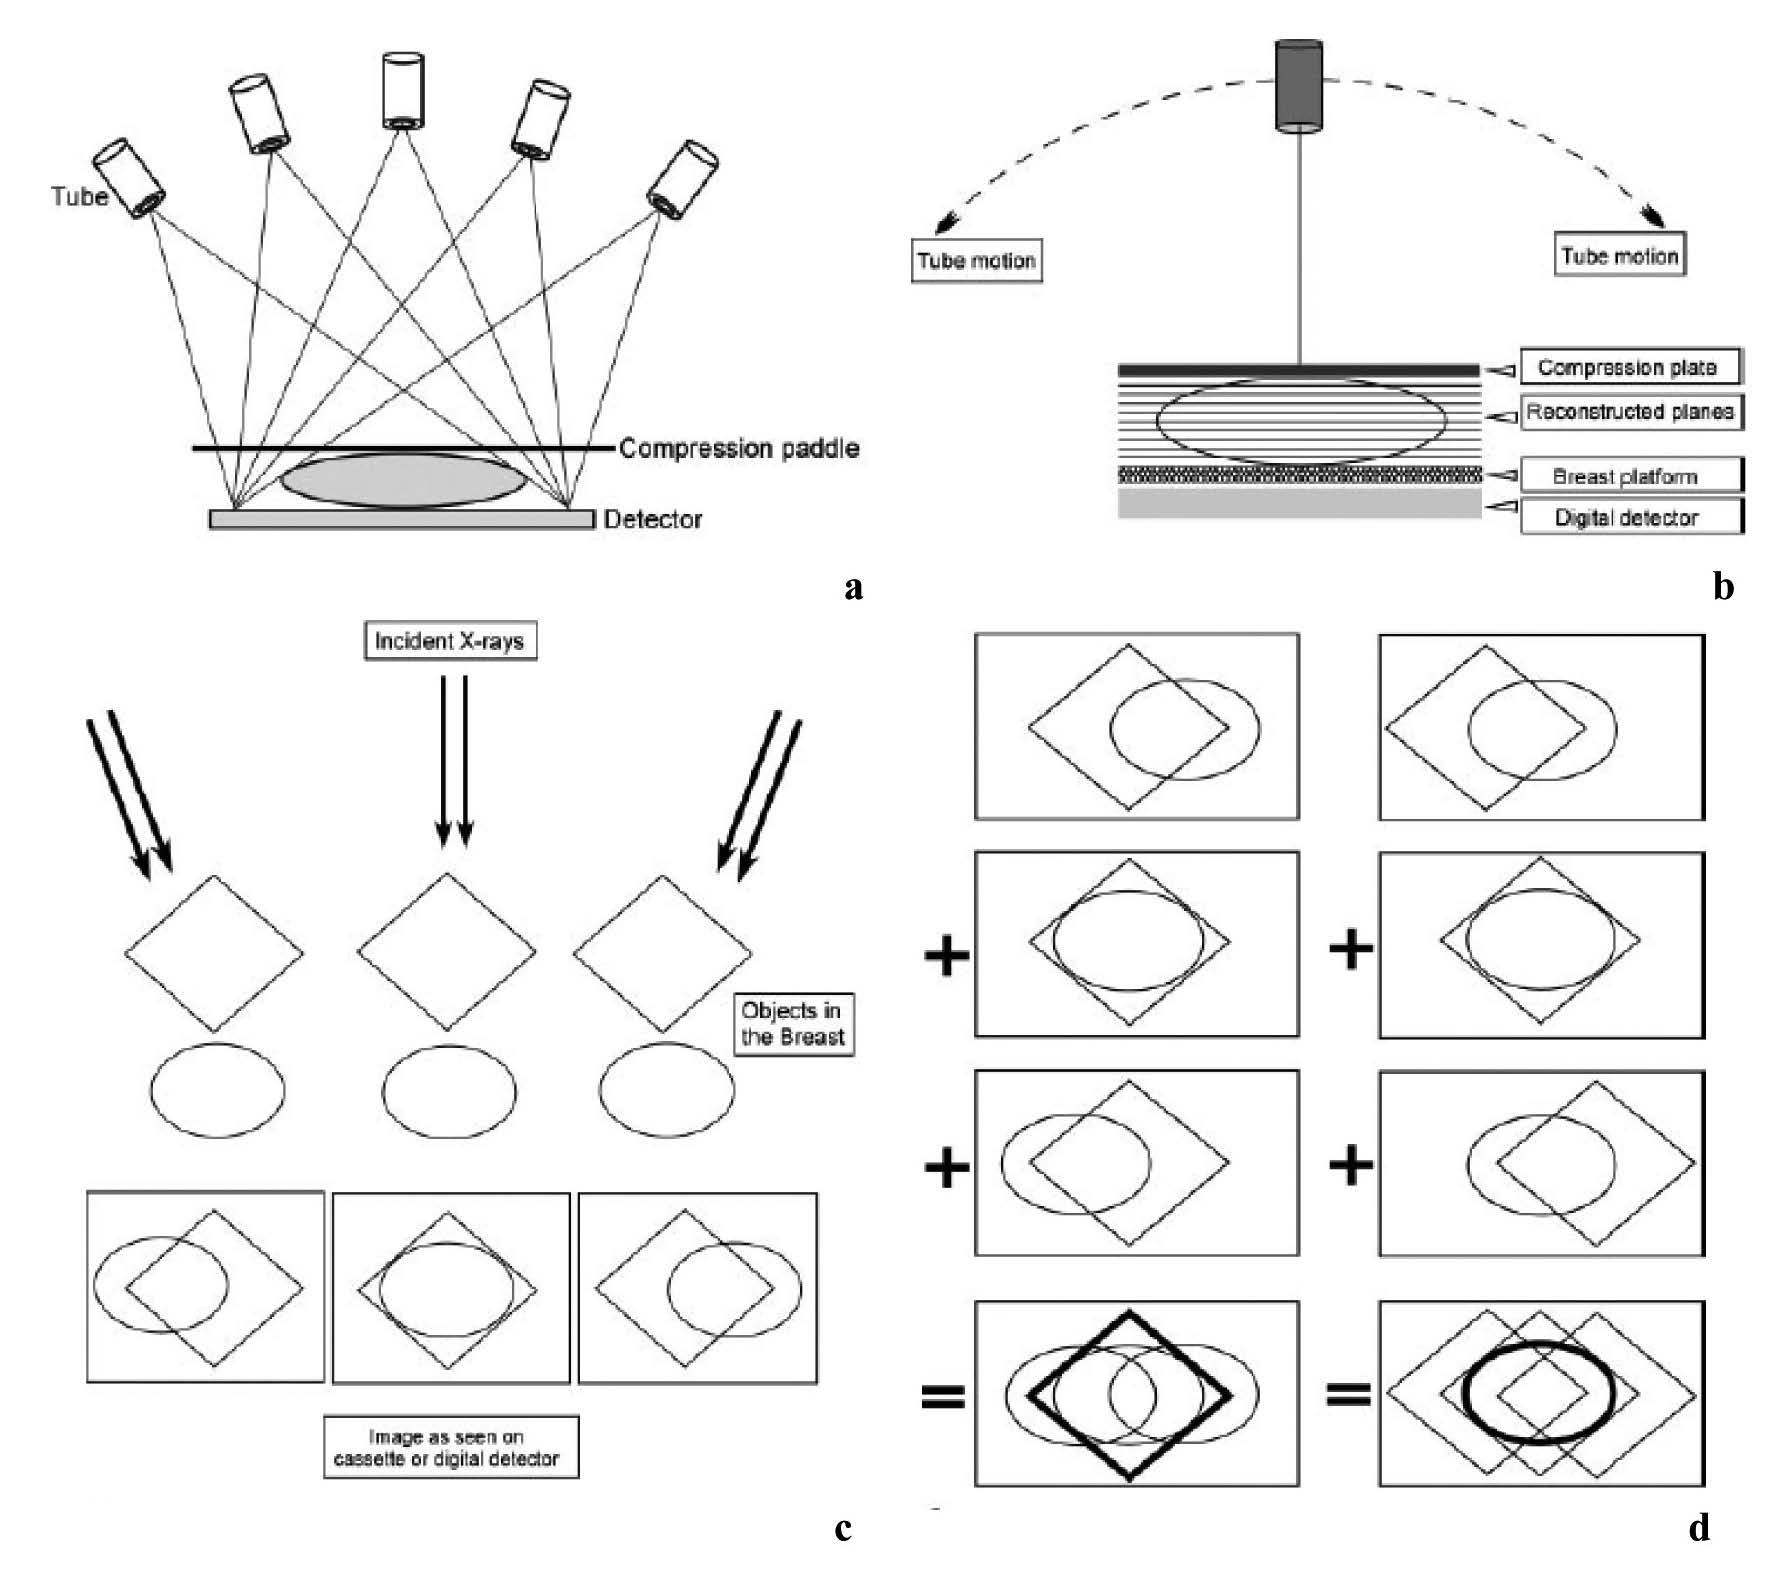
Basic technologic principles of breast tomosynthesis. (a,b) Schemans shows how image data are acquired from various angles as the x-ray tube moves in an arc. Either the step-and-shoot method (a) or the continuous exposure method (b) may be used, and the detector may be moving or stationary during image acquisition. The 3D image data are subsequently reconstructed as conventional mammographic projections (cranio-caudal, mediolateral oblique and mediolateral view). (c, d) Diagrams show how different 3D image data aquired from different angles (c) are reconstructed to provide separate depiction of two overlapping structures located in different planes (d).
Figure 13:
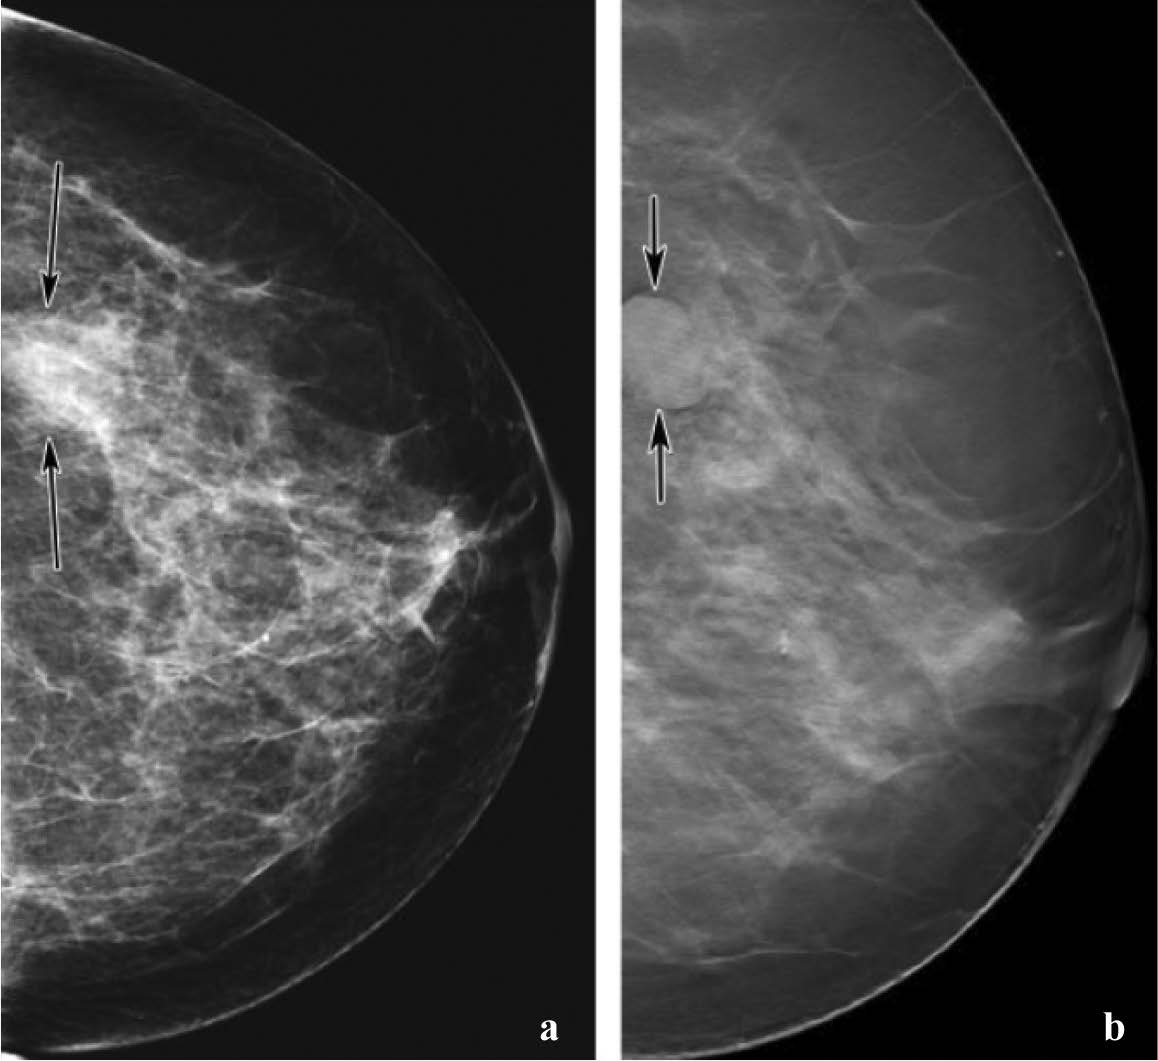
Mass (arrow) depicted in the mediolateral oblique view on (a) and (b) screen-film mammograms. The spicules of the mass are much more conspicuous. (Radiology 2005; 237:1075-1080)
Figure 14:
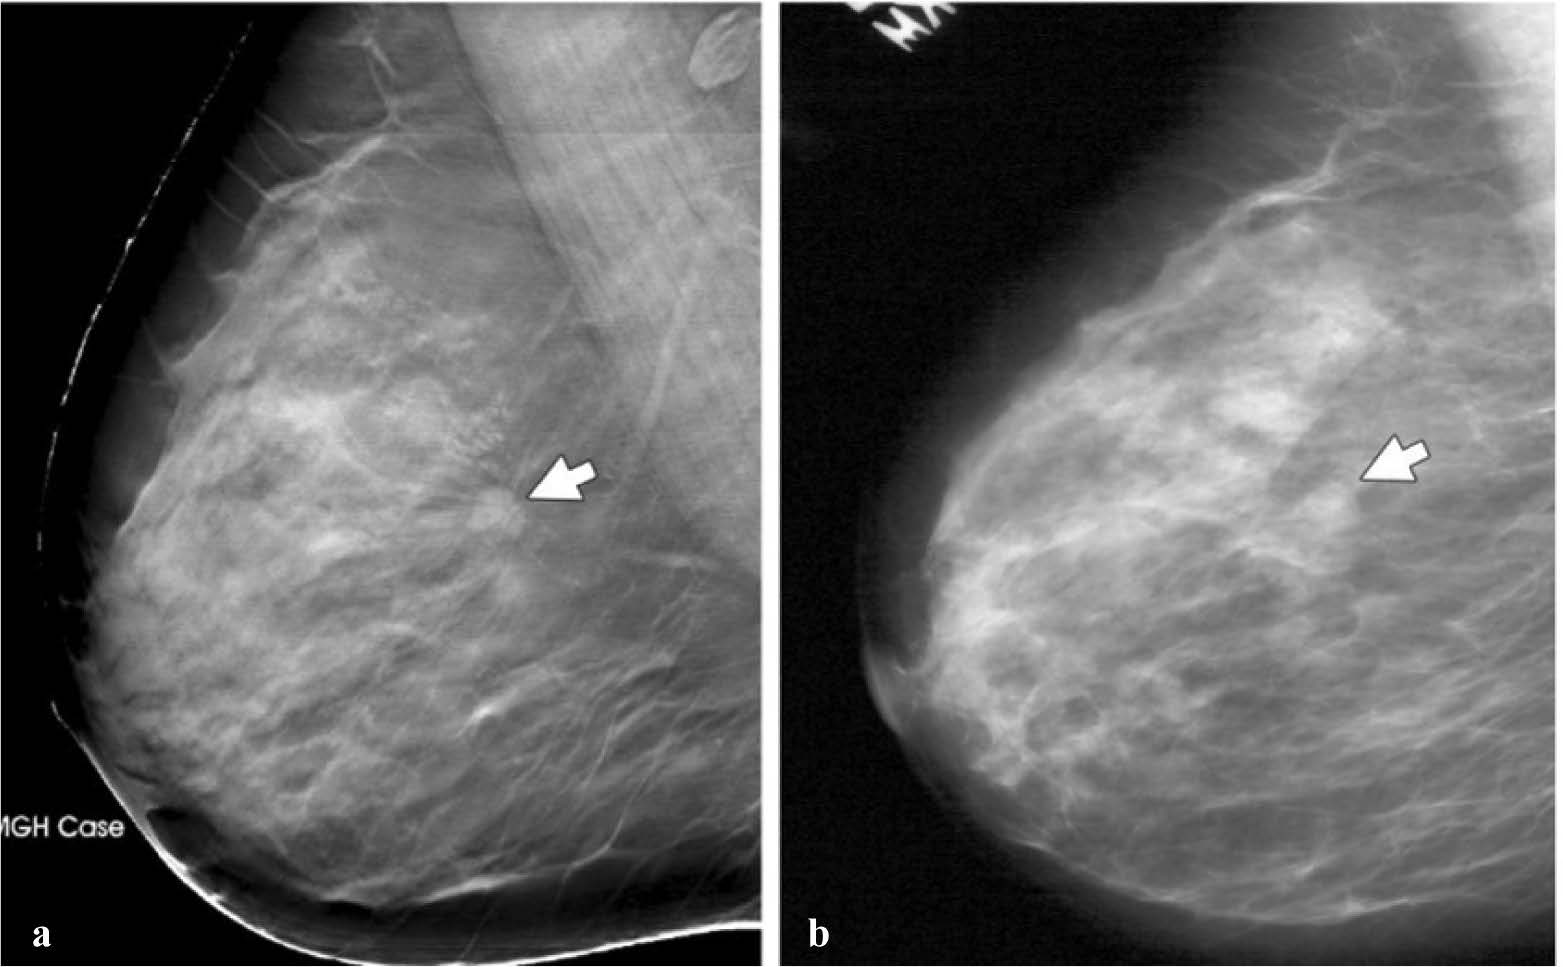
Comparison of screening mammography with breast tomosynthesis in a 57-year-old woman.
(a) Digital mammogram shows a mass (arrows) in the lower outer part of the left breast. The mass is not clearly visible because of surrounding dense tissue. (b) Breast tomosynthesis image provides clearer depiction of the mass (arrow), which is well circumscribed. Because its’ US appearance remained stable for 2 years, the mass was considered benign. (See also Movie 1 at radiographics.rsnajnls.org/cgi/content/full/27/S231/DC1)
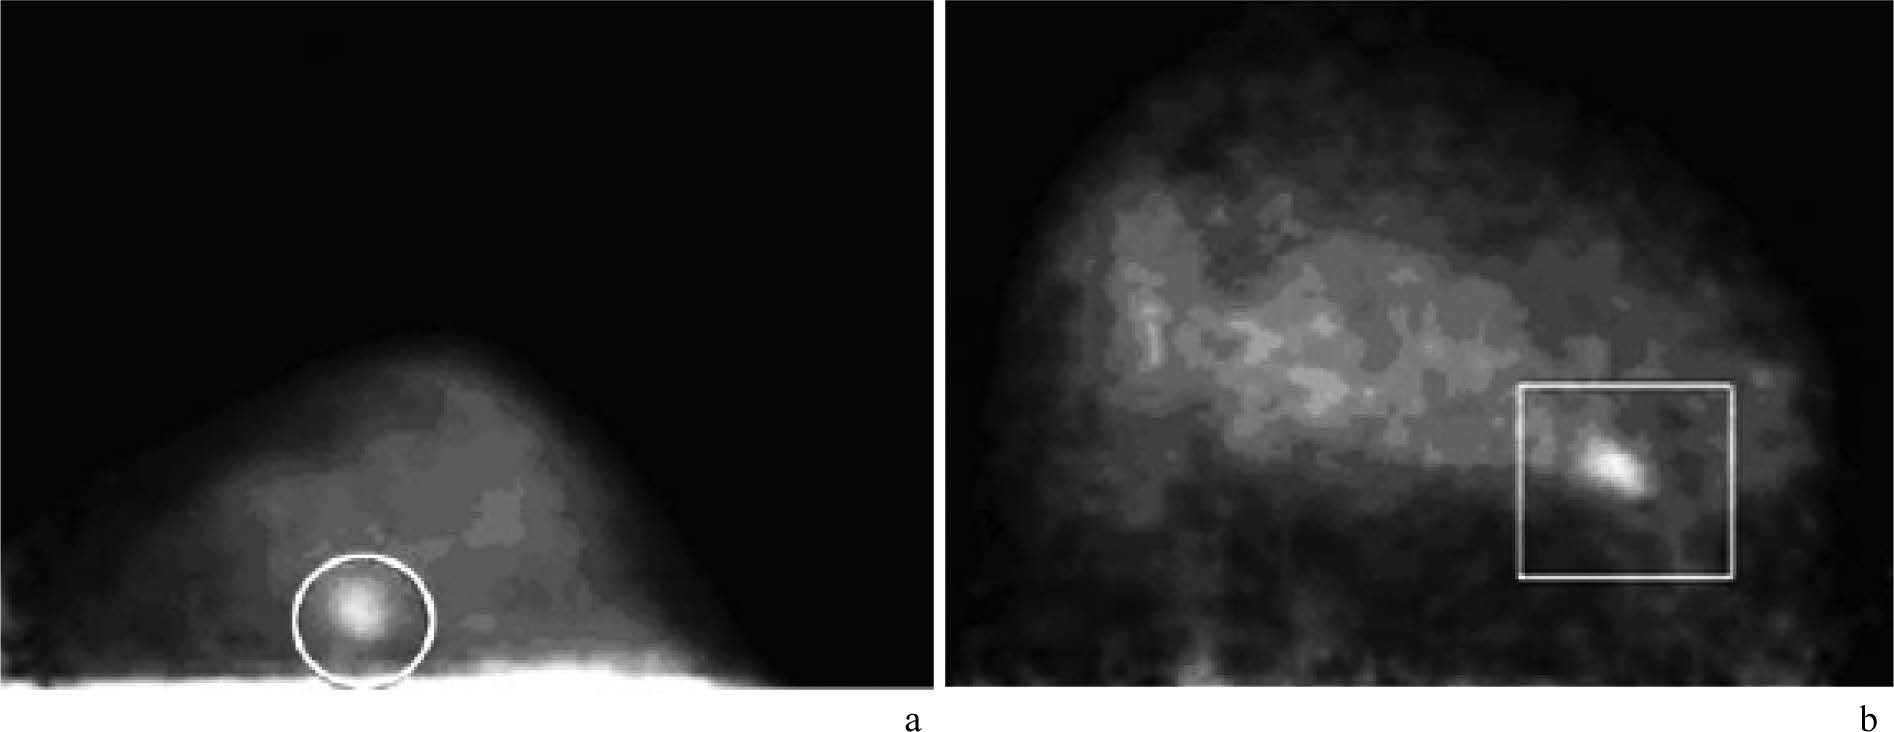
Figure 15:
Demonstration of small invasive breast carcinomas with FDG PEM. Images from dedicated breast PEM units show 9-mm (circle in a) and 1.3-cm (rectangle in b) invasive carcinomas. (RadioGraphics 2007; 27:S215-S229)
Table 1:
Summary of the Results of Published FDG PEM Studies
Figure 16:
BSGI of 73-year-old woman shows vague mam- mographic architectural distortion in lower outer right breast. (a) CC and (b) MLO views show focal radiotracer uptake (arrow). Pathologic findings showed multifocal DCIS with no focus larger than 4 mm. Left breast (c) CC and (d) MLO views demonstrate small focal area of increased radiotracer uptake (arrows). Patient had normal mammogram and initial US findings. Second-look US identified vague hypoechoic area. Surgical excisional biopsy results showed single 4-mm focus of low- grade DCIS, which was occult and unidentified prior to BSGI.
Figure 17:
Results of PET/CT in a patient suspected of having recurrent breast carcinoma. Axial contrast-enhanced CT (a), coronal PET (b), coronal fusion (c), and sagittal fusion (d) images show extensive local recurrence involving the breast, sternum, anterior chest wall, and pleura as well as hilar metastases and diffuse bone metastases. (RadioGraphic Octerber 2007 volume 27)
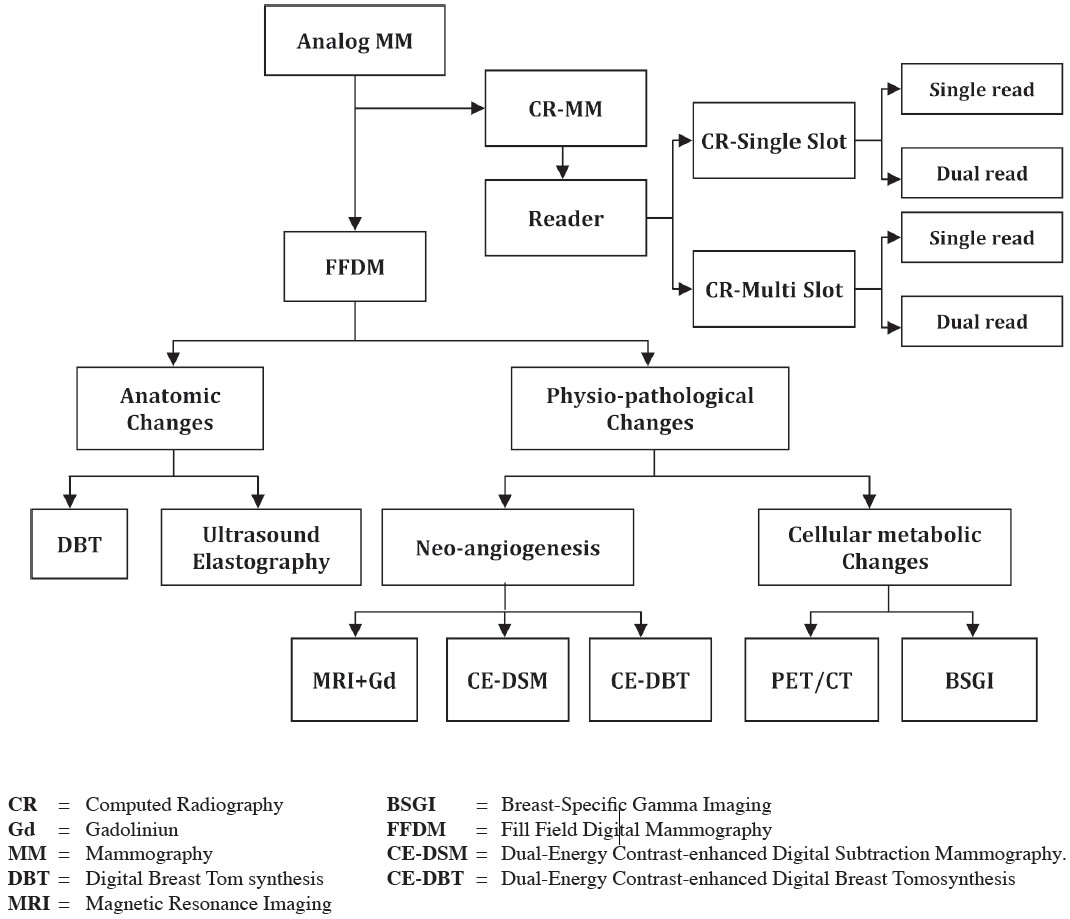
CR = Computed Radiography
Gd = Gadoliniun
MM = Mammography
DBT = Digital Breast Tom synthesis
MRI = Magnetic Resonance Imaging
BSGI = Breast-Specific Gamma Imaging
FFDM = Fill Field Digital Mammography
CE-DSM = Dual-Energy Contrast-enhanced Digital Subtraction Mammography.
CE-DBT = Dual-Energy Contrast-enhanced Digital Breast Tomosynthesis