Electronic ISSN 2287-0237

VOLUME

HEPATIC CYST VERSUS HEMANGIOMA: USEFUL T2-FLAIR IMAGE FOR DIFFERENTIATION

FEBRUARY 2017 - VOL.13 | ORIGINAL ARTICLE
OBJECTIVE

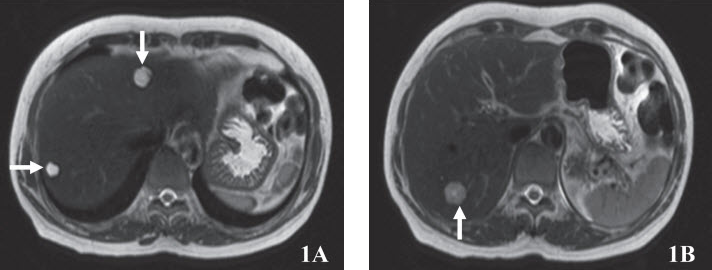
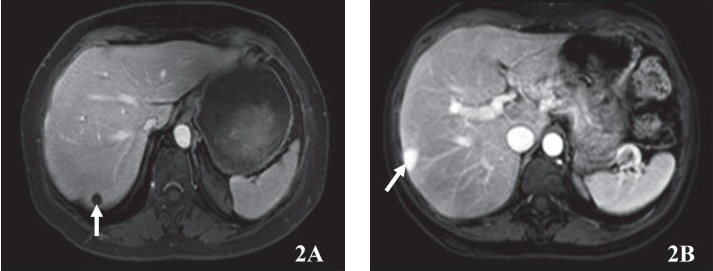
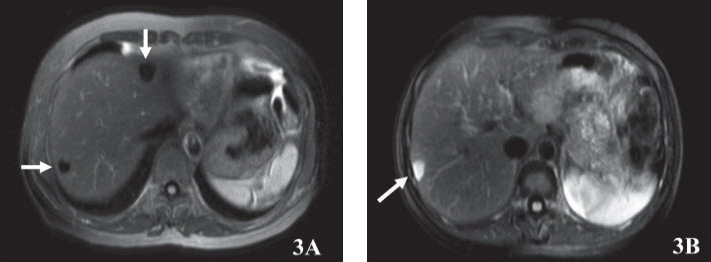
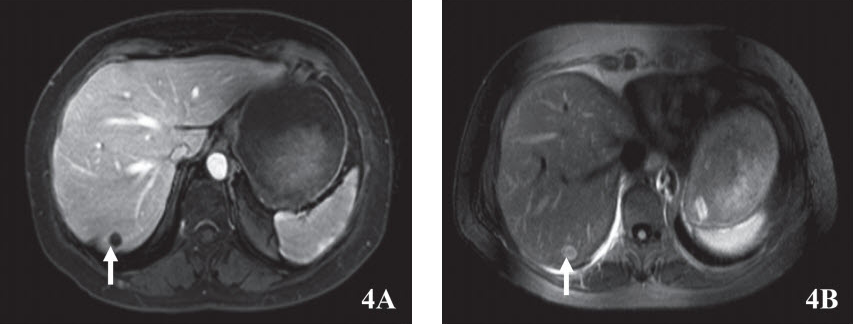
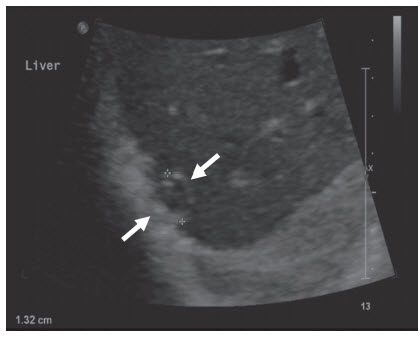
To study the concordance between diagnosis of hepatic cyst and hepatic hemangioma by using T2-FLAIR and multiphase contrasted MRI liver.

MATERIALS AND METHODS

All cases for MRI liver who were diagnosed to be hepatic cyst and hepatic hemangioma by multiphase contrasted MRI liver and T2-FLAIR images form year 2014 to 2015 at Bangkok Hospital Headquarters, Bangkok, Thailand. The total 106 nodules were reviewed by two experienced radiologists and analyzed the new and previous reports for concordance and interpretation of the results.

RESULTS

The new reports from T2-FLAIR images compared with report from contrasted MRI liver. The findings of the concordance to be hemangioma are 73 nodules and hepatic cysts for 32 nodules. There is only one nodule which is not corresponding. Hence, the concordance of these two studies is 99.05%.

CONCLUSION

By using T2-FLAIR and contrasted MRI liver to differentiate of hepatic cysts and hemangioma, resulted in concordance of reading is 99.05%.

Keywords

T2-FLAIR, hepatic cyst, hemangioma, MRI liver, multiphase contrasted MRI liver

DOI:

10.31524/bkkmedj.2017.02.006

MEDIA
Figure 1
1A: T2W images with longTE (3T,TR 1146 ms, TE 70 ms) of hepatic cysts reveal small two bright lesions at segment IVa and VIII (see arrows). 1B: The lesion at segment VII is less brightness signal than CSF but it appears brighter signal than spleen, indicating of hepatic hemangioma (see arrow).
Figure 2
2A shows axial post contrasted images (THRIVE sequence, 3T, TR 3.2 ms, TE 1.5 ms) reveal a non-enhancing nodule at segment VII which is representative of hepatic cyst (see arrow) but in case of hemangioma reveals homogeneous enhancement on subsequent images of 2B see arrow.
Figure 3
3A shows axial T2FLAIR images (3T, TR 1100 ms, TE 105 ms) show two dark lesions at segment II and VII, compatible with hepatic cyst. On the other hand, the subcapsular hemangioma in segment VIII demonstrates bright signal on FLAIR image as seen on 3B (3T, TR 1100 ms, TE 107 ms).
Figure 4
4A show axial post contrast images (THRIVE sequence, 3T, TR 3.2 ms, TE 1.5 ms) showed a non-enhancing lesion in segment VII, being mild hyperintense FLAIR (3T,TR 11000,TE 107 ms) signal on 4B, could be a hemorrhagic cyst, and this was confirmed by sonography in Figure 5.
Figure 5
The sonography of the liver showed a subcapsular cyst with echoic content in right hepatic lobe, and represented hemorrhagic cyst.
SEARCH VOLUME & NUMBER
GO
RECENT VOLUME & NUMBER